
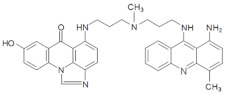
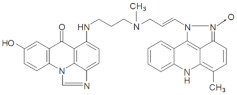
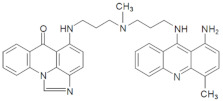
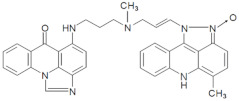
Table 3.
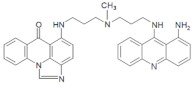
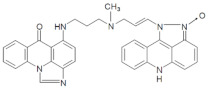
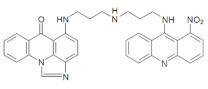
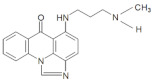
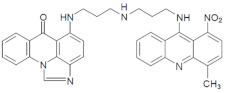
The structures proposed for main metabolites of UAs formed with P4503A4 and 450P2C19 isoenzymes (1 mg/mL P450 and 2 mM NADPH cofactor) on the basis of their ESI-MS and ESI-Q-TOF-MS (ElectroSpray Ionistaion-Quadrupole-Time of Flight-Mass Spectrometry) analyses.
| Metabolite | HPLC Retention Time [min] |
ESI-MS m/z |
ESI-Q-TOF-MS m/z |
Proposed Structure |
|---|---|---|---|---|
| M128 | 15.06 | 556.25 [M + H-30]+ |
556.2799 [M+H-30]+ |
|
| M228 | 18.10 | 568.25 [M+H-18]+ |
568.2458 [M+H-18]+ |
|
| M328 | 18.42 | 572.25 [M+H-14]+ |
572.2403 [M+H-14]+ |
|
| M428 | 15.64 | 307.25 | 307.1545 |
|
| M145 | 14.10 | 586.25 [M+H-30]+ |
586.2928 [M+H-30]+ |
|
| M245 | 18.40 | 598.25 [M+H-18]+ |
598.2554 [M+H-18]+ |
|
| M153 | 16.23 | 570.25 [M+H-30]+ |
570.2975 [M+H-30]+ |
|
| M253 | 20.50 | 582.25 [M+H-18]+ |
582.2612 [M+H-18]+ |
|
| M353 | 20.16 | 586.25 [M+H-14]+ |
586.2563 [M+H-14]+ |
|