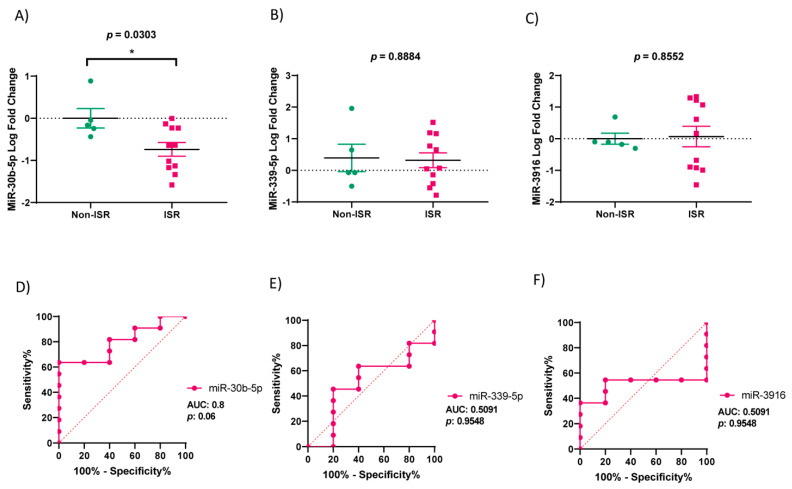
Figure 5.
Validation of miRNA expression and ROC analysis in the non-ISR (green) and ISR (rose) patients’ groups. (A–C) Graphs showing levels of miR-30b-5p, miR-339-5p and miR-3916 in non-ISR and ISR, expressed in log of fold change. Values are means ± S.E.M (n = 16). “*” indicates significance at p < 0.05. (D–F) Graphs illustrate area under the curve (AUC) analysis of ROC indicating sensitivity and specificity of miR-30b-5p, miR-339-5p and miR-3916. Green and rose colors indicate Non-ISR and ISR patients respectively.

