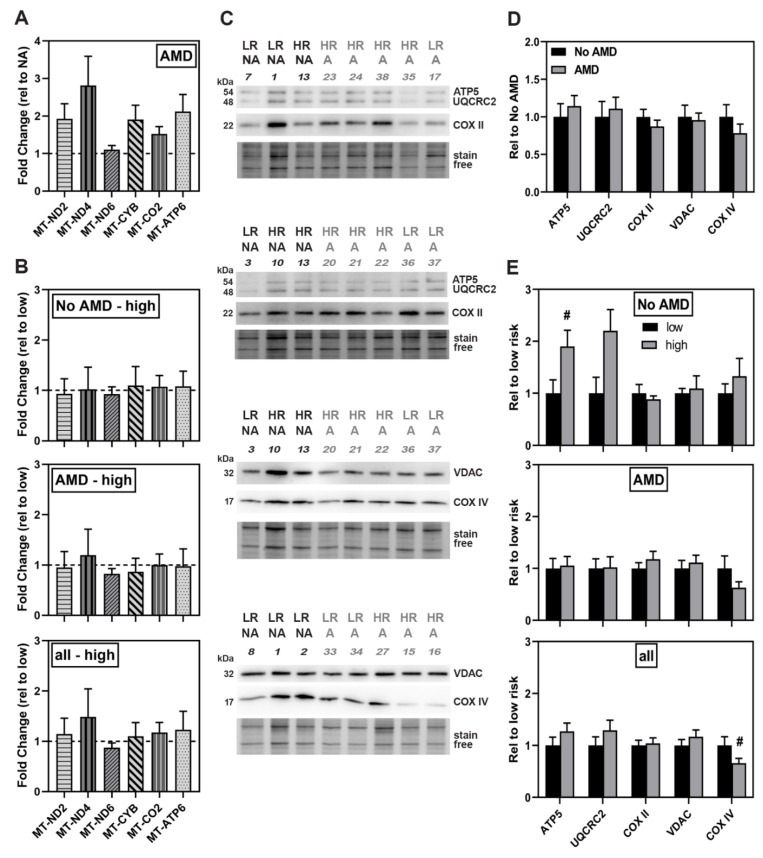
Figure 4.
No significant difference in gene expression or content of mitochondrial-related proteins. (A,B) Gene expression analysis by qRT-PCR of OXPHOS genes in (A) iPSC-RPE from No AMD (5 donors, 8 lines) and AMD donors (13 donors, 20 lines) or (B) CFH low-risk (No AMD 3 donors, 5 lines; AMD 5 donors, 8 lines) and high-risk (No AMD 1 donor, 2 lines; AMD 8 donors, 12 lines). Results are fold-change in expression relative to the average for (A) No AMD donors (dashed line) or (B) high-risk relative to the average of low-risk samples (dashed line). In (A) and (B), there were no significant differences as assessed by un-paired t-tests of ΔΔCt values. (C) Representative image of western blots used to analyze protein content of iPSC-RPE cells. NA = No AMD, A = AMD. LR = low risk, HR = high risk. Numbers correspond with specific donor lines listed in Table 1. Stain free image below blot was used to normalize protein load. (D,E) Content analysis of mitochondrial-related proteins in (D) No AMD (7 donors, 9 lines) and AMD (13 donors, 21 lines) iPSC-RPE or (E) Low-risk (No AMD 4 donors, 5 lines; AMD 5 donors, 8 lines) and high-risk (No AMD 3 donors, 4 lines; AMD 8 donors, 13 lines). Data were normalized to the mean density for (D) No AMD iPSC-RPE or (E) low-risk iPSC-RPE. All data are mean ± SEM. # p < 0.1 determined by un-paired t-test. All other comparisons were not statistically different.

