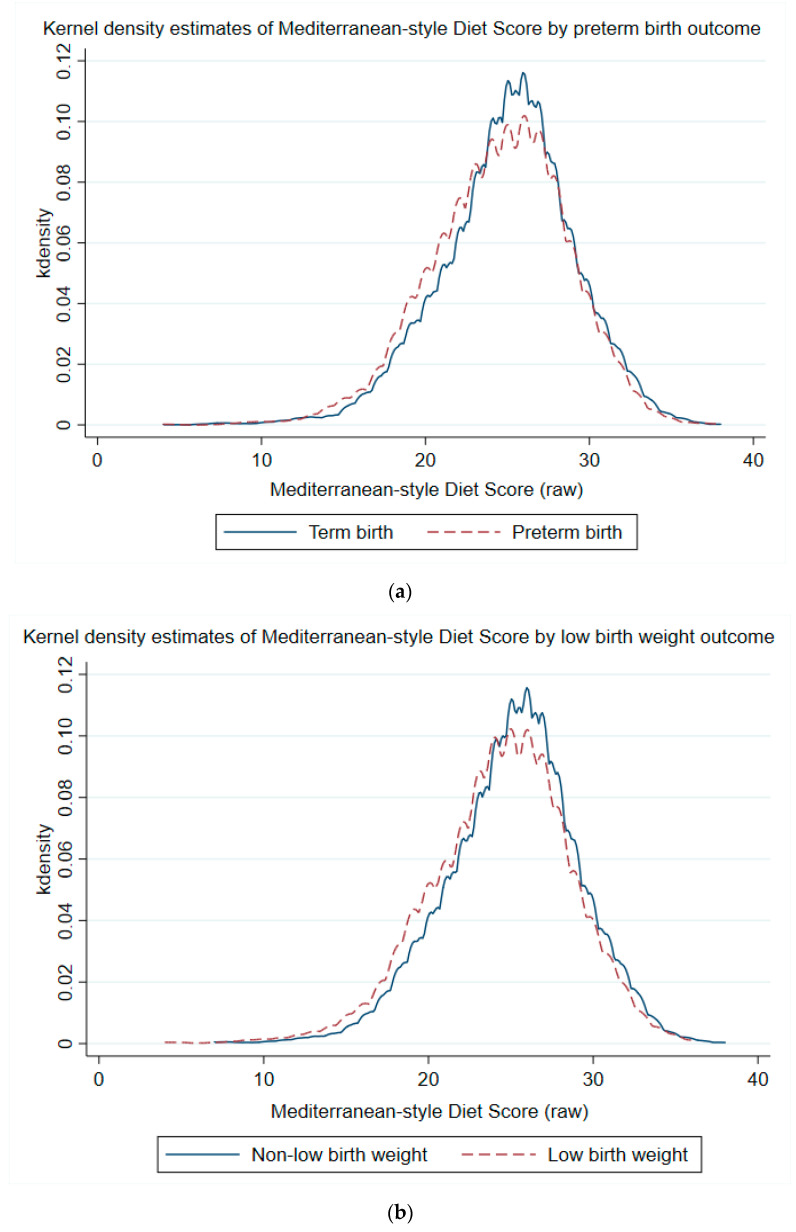
Figure 2.
(a) Kernel density plots of Mediterranean-style diet score by birth outcomes. Shown are outcomes related to duration of pregnancy, with blue curve for term birth and red dashed curve for overall preterm birth. No adjustments were made for these plots. The x-axis represents the raw aggregate Mediterranean-style diet score. (b) Kernel density plots of Mediterranean-style diet score by birth outcomes. Shown are outcomes related to birth weight, with blue curve for non-low birth weight and red dashed curve for low birth weight. No adjustments were made for these plots. The x-axis represents the raw aggregate Mediterranean-style diet score.

