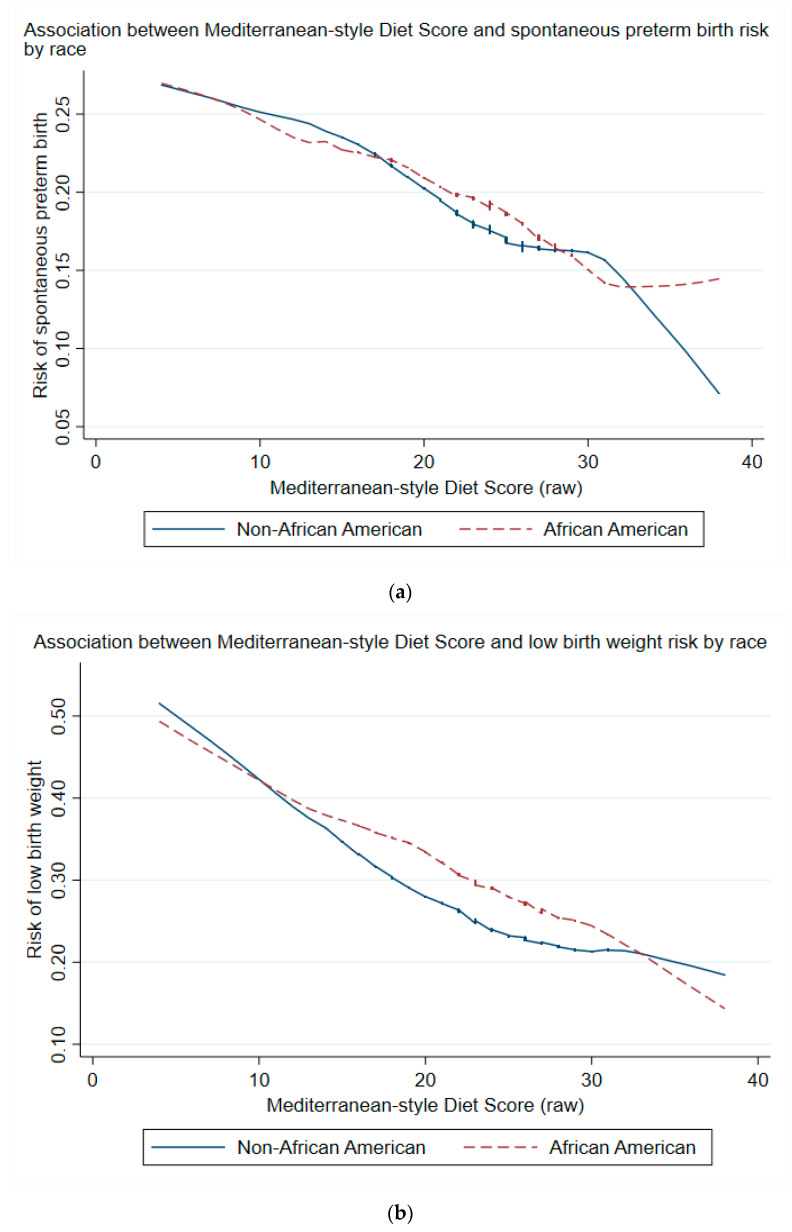
Figure 3.
(a) Locally weighted scatterplot smoothing of spontaneous preterm birth outcome by MSDS (raw) stratified by race (blue curve for non-African American, red dashed curve for African American). Shown are smoothed curves provided by a weighted quadratic least squares regression over the respective relative risk values. No adjustments were made for this plot. X-axis represents the raw aggregate Mediterranean-style diet score. (b) Locally weighted scatterplot smoothing of low birth weight outcome by MSDS (raw) stratified by race (blue curve for non-African American, red dashed curve for African American). Shown are smoothed curves provided by a weighted quadratic least squares regression over the respective relative risk values. No adjustments were made for this plot. X-axis represents the raw aggregate Mediterranean-style diet score.

