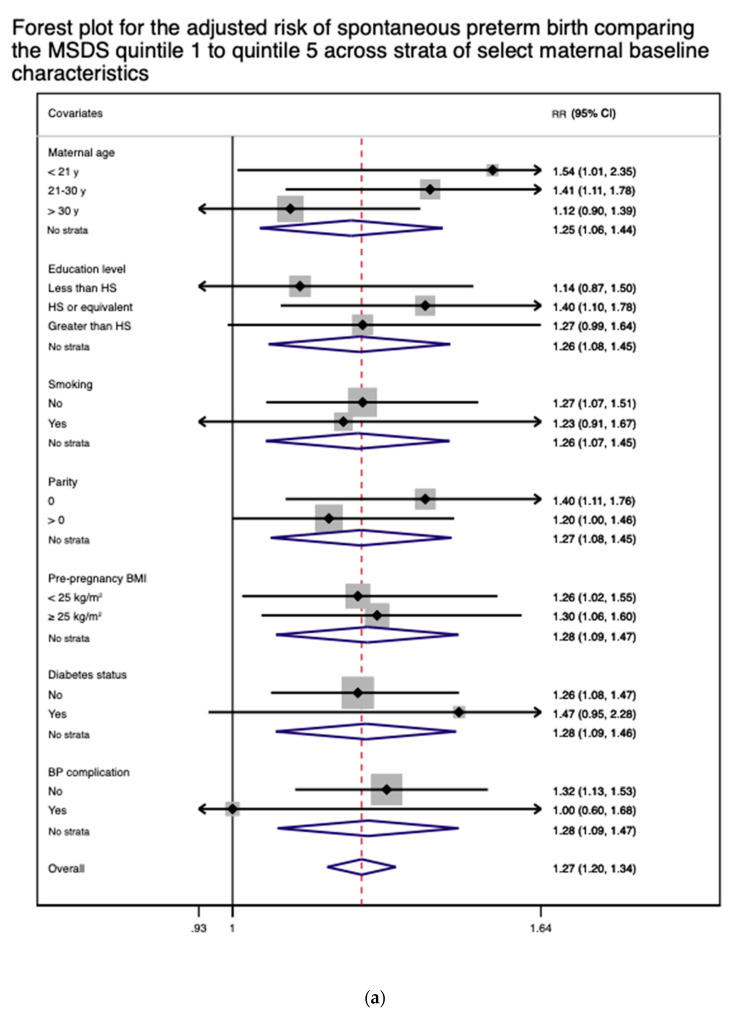
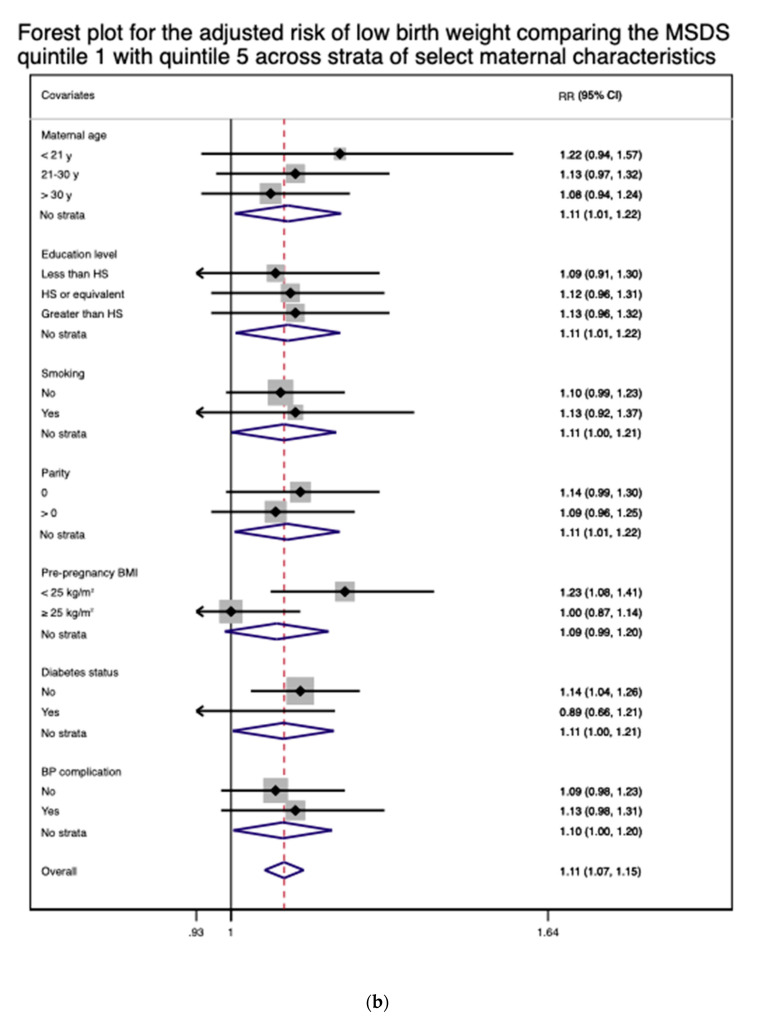
Figure 4.
(a) A forest plot for the adjusted relative risk (RR) of spontaneous preterm birth comparing the first MSDS quintile with the fifth quintile across the strata of select maternal characteristics. The results were adjusted for all applicable covariates except for child sex. (b) A forest plot for the adjusted relative risk (RR) of low birth weight comparing the first MSDS quintile with the fifth quintile across the strata of select maternal characteristics. The results were adjusted for all applicable covariates except for child sex.


