Figure 3.
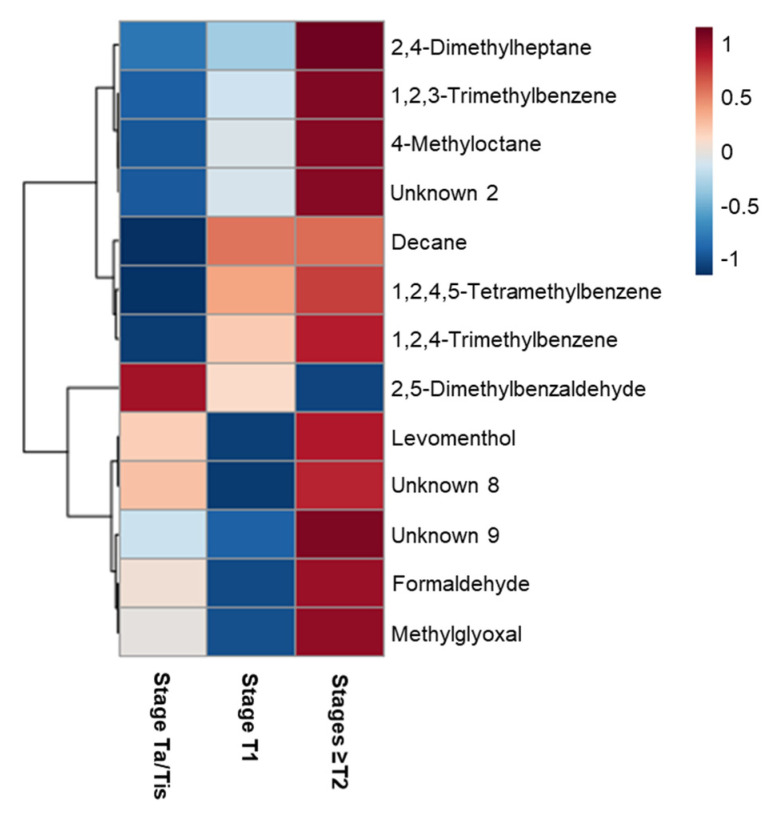
Heatmap illustrating the levels of urinary volatile metabolites changing between NMIBC (stage Ta/Tis and T1) and MIBC (stages ≥T2) patients. Columns correspond to each sample group, while rows correspond to the mean normalized peak area of each discriminant volatile metabolite colored from minimum (−1, dark blue) to maximum (1, dark red).

