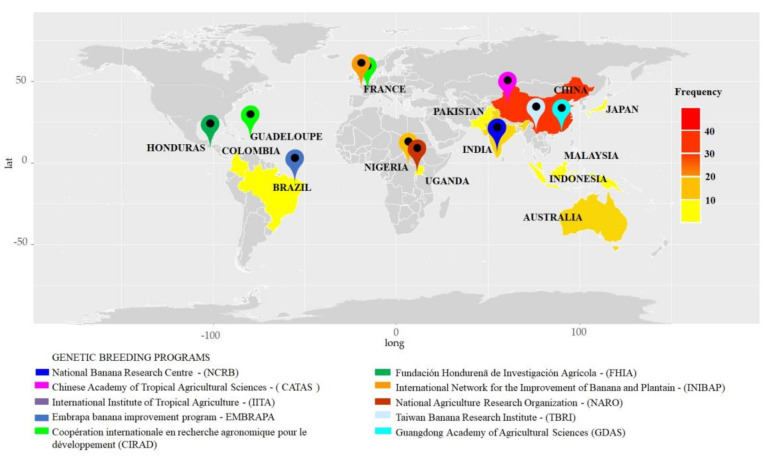
Figure 4.
Frequency of articles on genetic improvement of Musa spp. to Fusarium wilt published in the last ten years in different countries and genetic breeding programs of the banana mentioned. The light yellow tones indicate a frequency below 10% of the articles considered in this review; the intermediate tones indicate frequencies between 10 and 30%, and the intense red tones indicate frequencies above 40%. The location icons indicate the locations of Musa breeding programs identified by the colors. The map was plotted in R, using the packages maps, ggmap, geosphere, Eurostat, GADMTools, country code and ggplot2. lat: latitude; long: longitude.

