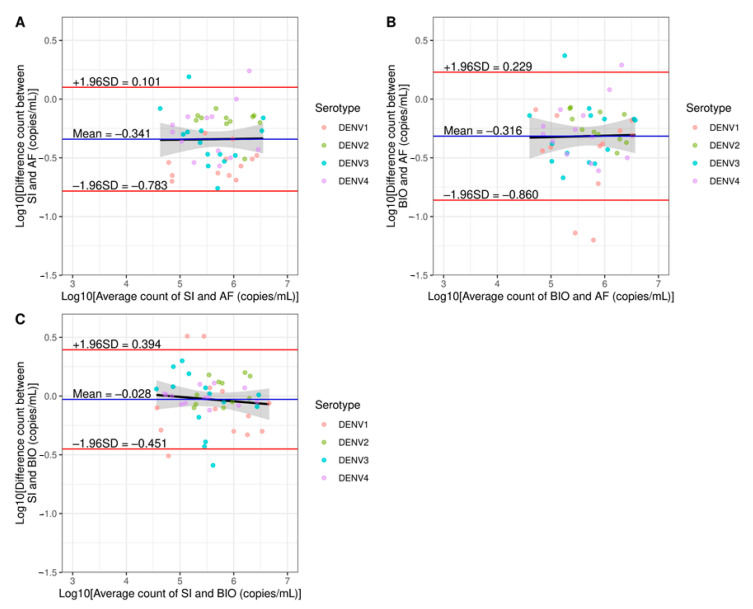
Figure 6.
Bland–Altman plots for interlaboratory variations. Bland–Altman plots of RT-ddPCR results between two laboratories: (A) SI versus AFRIMS (AF), (B) BIOTEC (BIO) versus AFRIMS (AF), and (C) SI versus BIOTEC (BIO) with LOQ filtering. The horizontal black dashed lines represent agreement lines. The horizontal blue lines show mean differences between the two methods (bias). The horizontal red lines show agreement limits.

