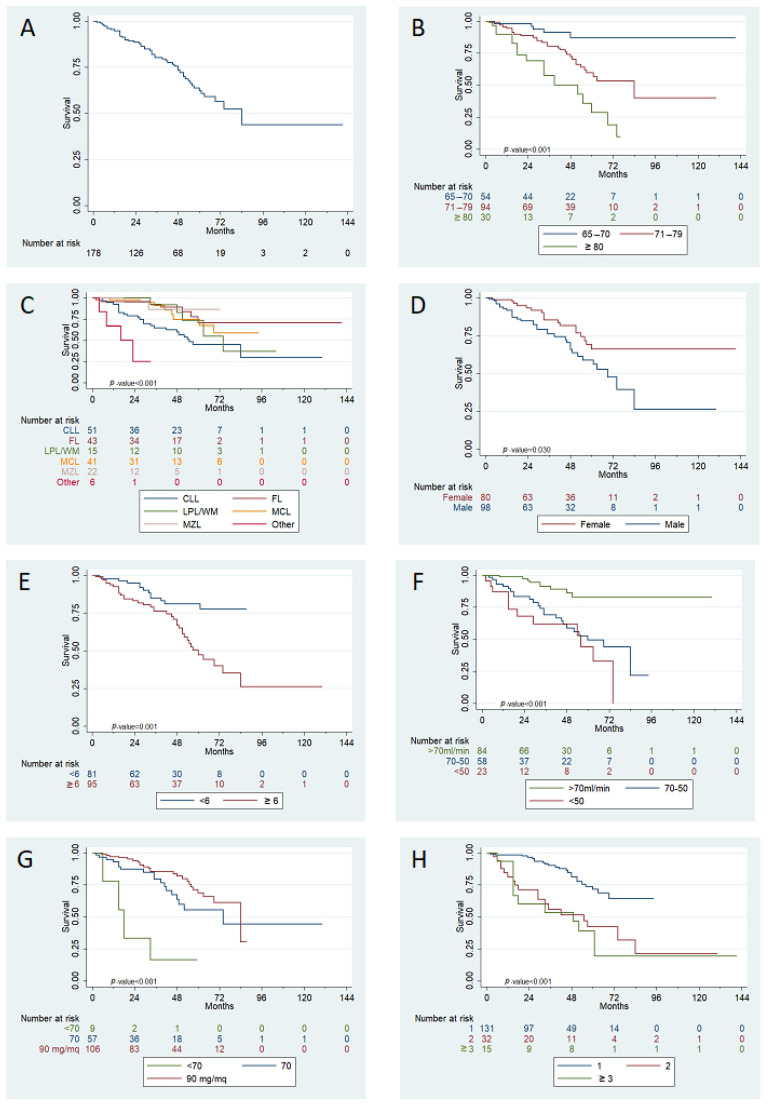
Figure 2.
Univariate analysis for OS. panel (A): median OS after bendamustine-based treatment initiation, overall series; panel (B): OS according to different age classes; panel (C): OS stratified accoding to initial diagnosis; panel (D): OS divided by patients’ sex; panel (E): OS according to CIRS score; panel (F): according to BCC at baseline; panel (G): effect of bendamustine dose received on OS; panel (H): OS stratified according to line of therapy at bendamustine treatment.

