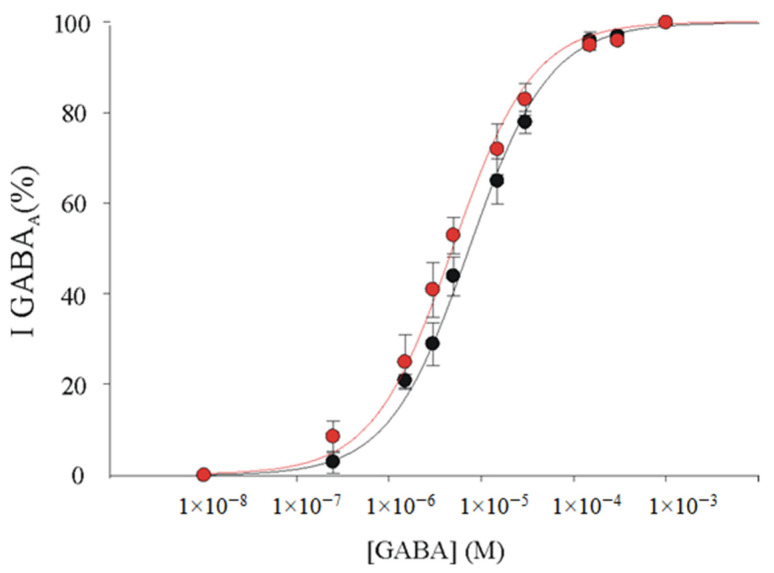
Figure 4.
GABAARs affinity in oocytes expressing α1β2γ2 GABAARs or α1β2 GABAARs. GABA dose–current relationships in oocytes injected with α1β2γ2 (●) or α1β2 cDNAs (●). Peak currents were normalized to the current obtained with 1 mM GABA and refer to 6 oocytes each point. EC50 and nH were 7.36 ± 0.47 μM and 1.0 ± 0.04 for α1β2 receptors; 5.0 ± 0.15 μM and 0.99 ± 0.1 for α1β2γ2; p > 0.05, Mann–Whitney rank sum test.

