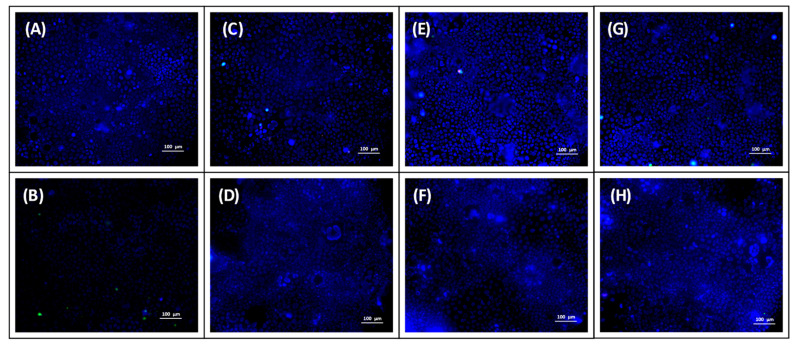
Figure 10.
Fluorescence microscope images of fluorescently labeled oligonucleotide (OND) (A) MES-HBSS buffer, (B) OND solution in MES-HBSS buffer, (C,D) nonloaded Citrem and Standard SEDDS dispersed in OND solution, respectively, (E,F) DDAB-OND loaded in Citrem and Standard SEDDS, respectively, and (G,H) DOTAP-OND loaded in Citrem and Standard SEDDS, respectively. The size bar represents 100 µm. Blue represents the cell nuclei of living cells stained by Hoechst dye, red represents dead cells stained by propidium iodide and green represents fluorescently labeled OND.

