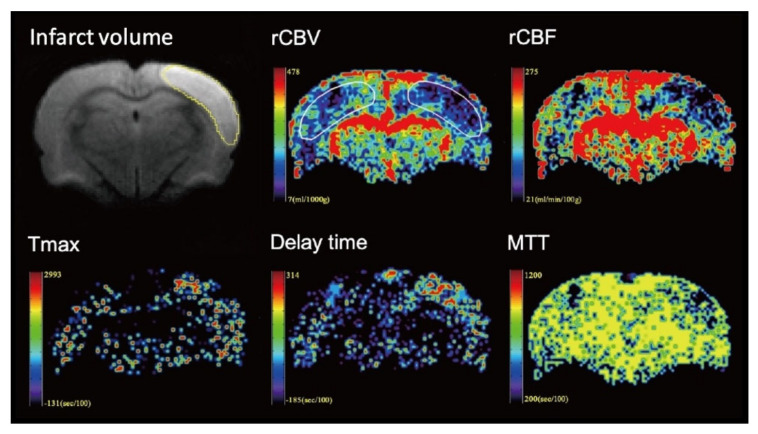
Figure 2.
Representative images from one rat of the control group. The volume of the infarction was manually measured on the diffusion-weighted imaging (DWI) map. To measure the perfusion indices, the region of interest (ROI) was manual drawing in the infarcted hemisphere on the relative cerebral blood volume (rCBV) image. A mirror ROI on the contralateral healthy hemisphere was then generated automatically by the software. The ROIs were applied to other perfusion maps to measure other perfusion indices.

