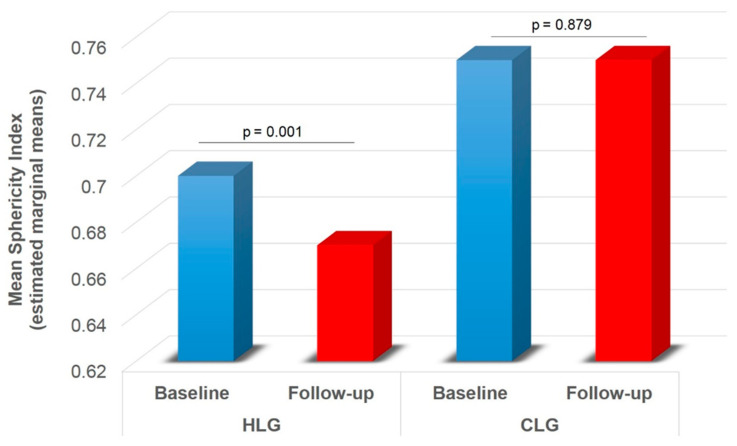
Figure 7.
Ablation zone mean sphericity index across HLC and CLG for baseline and follow-up (significant group by time interaction effect). HLC = healthy liver group; CLG = cirrhotic liver group mean short axis 1 and short axis 2 diameters. Values are estimated marginal means following 2 × 2 mixed model ANOVA (group by time), controlling for gender (gender = 1.30). Bonferroni corrected p-values are presented for each comparison between baseline and follow-up within each group.

