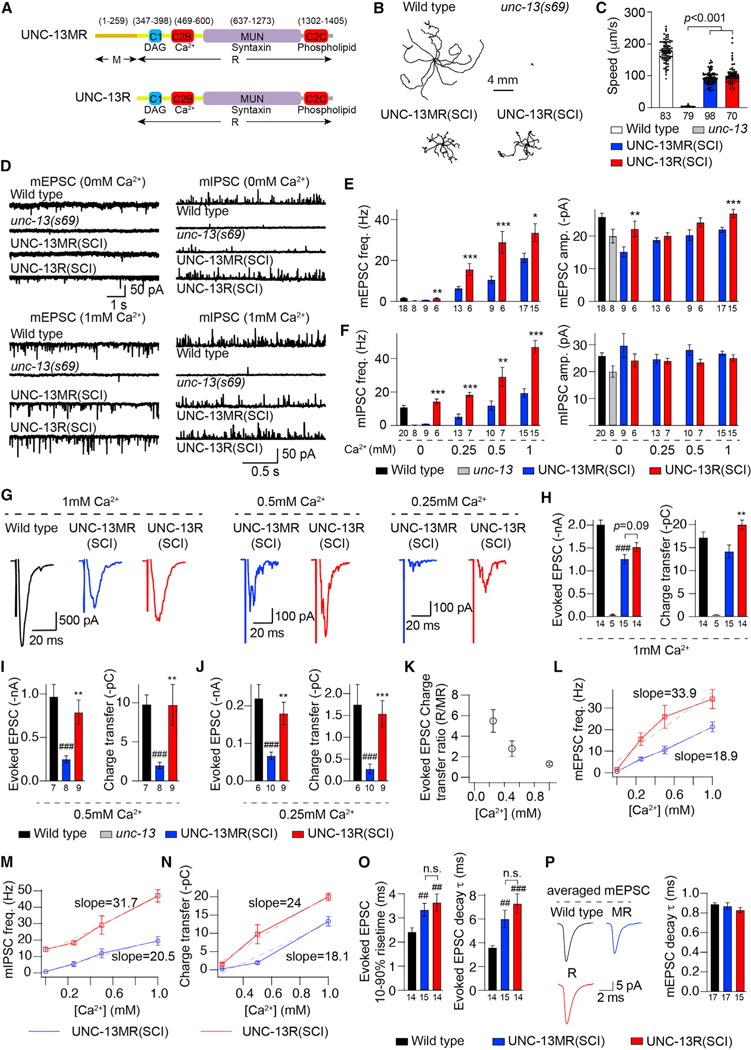
Figure 1. The M domain in UNC-13MR inhibits spontaneous and evoked neurotransmitter release.
Miniature EPSCs/IPSCs and stimulus-evoked EPSCs were recorded from body wall muscle of adult worms in various Ca2+ levels.
(A) The domain structures of UNC-13MR and UNC-13R are illustrated. Ligands for each domain are indicated.
(B) Representative locomotory trajectories of 10 animals for wild type, unc-13(s69), and unc-13 rescued by single-copy insertion of UNC-13MR and UNC-13R under the pan-neuronal promoter. The starting points of each trajectory have been aligned for clarity.
(C) Quantification of the average locomotion speed for the indicated genotypes or transgenes.
(D) Representative mEPSC and mIPSC traces (recorded at 0-mM and 1-mM Ca2+) from the indicated genotypes. (E and F) Quantification of the frequency and amplitude of the mEPSCs and mIPSCs under all tested Ca2+ levels (0, 0.25, 0.5, and 1 mM) from the same genotypes as in (D).
(G) Example traces of stimulus-evoked EPSCs recorded in various Ca2+ levels (0.25, 0.5, and 1 mM) from wild-type (black), UNC-13MR-rescued (blue), and UNC-13R-rescued (red) animals.
(H–J) Quantification of the evoked EPSC amplitude and charge transfer from the same genotypes and Ca2+ levels as in (G).
(K) Ratio of the evoked EPSC charge transfer in UNC-13R-rescued worms to that in UNC-13MR-rescued animals in different Ca2+ levels.
(L–N) Comparison of the concentration effect for mEPSC frequency, mIPSC frequency, and evoked charge transfer versus extracellular Ca2+ concentration between the UNC-13MR- and UNC-13R-rescued animals.
(O) Quantification of the 10%–90% rise time and decay of the evoked EPSCs from wild-type, UNC-13MR, and UNC-13R-rescued animals (in 1-mM Ca2+).
(P) Representative traces of averaged mEPSCs (in 1-mM Ca2+) and quantification of mEPSC decay from wild-type, UNC-13MR, and UNC-13R-rescued animals. Data are means ± SEM. ##p < 0.01, ###p < 0.001 when compared with the wild type. *p < 0.05, **p < 0.01, ***p < 0.001 when compared with UNC-13MR-rescued animals; n.s., non-significant when compared with UNC-13MR-rescued animals. One-way ANOVA test for data in (C), (I), (J), and (P); one-way ANOVA after the Kruskal-Wallis test for data in (E) and (H). The number of worms analyzed for each genotype is indicated under the bar graphs.

