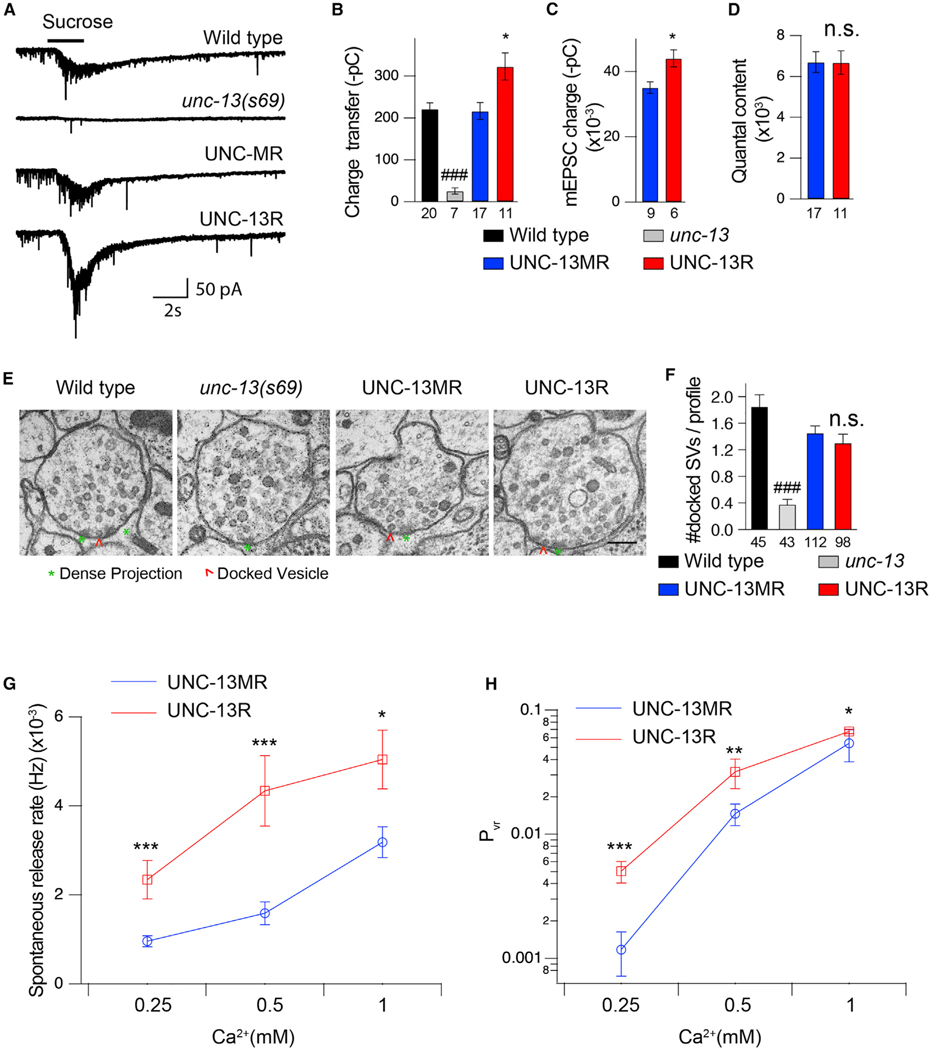
Figure 2. Deleting the M domain increases the fusogenicity of synaptic vesicles.
(A) Hypertonic sucrose-evoked current (recorded in 1-mM Ca2+) from wild-type (black), unc-13-null mutant (gray), UNC-13MR-rescued (blue), and UNC-13R-rescued (red) animals.
(B) Averaged charge transfer from the sucrose-evoked currents in (A).
(C and D) Quantification of the charge transfer of the mEPSCs (recorded in 1-mM Ca2+) and averaged quantal content in UNC-13MR- and UNC-13R-rescued animals.
(E) Presynaptic ultrastructure of cholinergic motor neuron synapses in wild-type, unc-13-null mutant, UNC-13MR-rescued, and UNC-13R-rescued animals. Asterisks indicate dense projection (DP); arrowheads indicate synaptic vesicles docked at the plasma membrane. Scale bar, 100 nm.
(F) Quantification of the number of synaptic vesicles docked at the plasma membrane per synaptic profile.
(G) Summary of the spontaneous vesicular release rate (mEPSC frequency divided by the number of vesicles in the RRP) in tested Ca2+ levels (0.25, 0.5, and 1 mM).
(H) Quantification of the probability of synaptic vesicle release (Pvr) in various Ca2+ levels (0.25, 0.5, and 1 mM) from the indicated genotypes.
Data are means ± SEM. ###p < 0.001 when compared with wild types, one-way ANOVA; *p < 0.05, **p < 0.01, ***p < 0.001 when compared with UNC-13MR-rescued animals, Student’s t test; n.s., non-significant when compared with UNC-13MR-rescued animals, Student’s t test. The number of worms analyzed for each genotype is indicated under the bar graphs.

