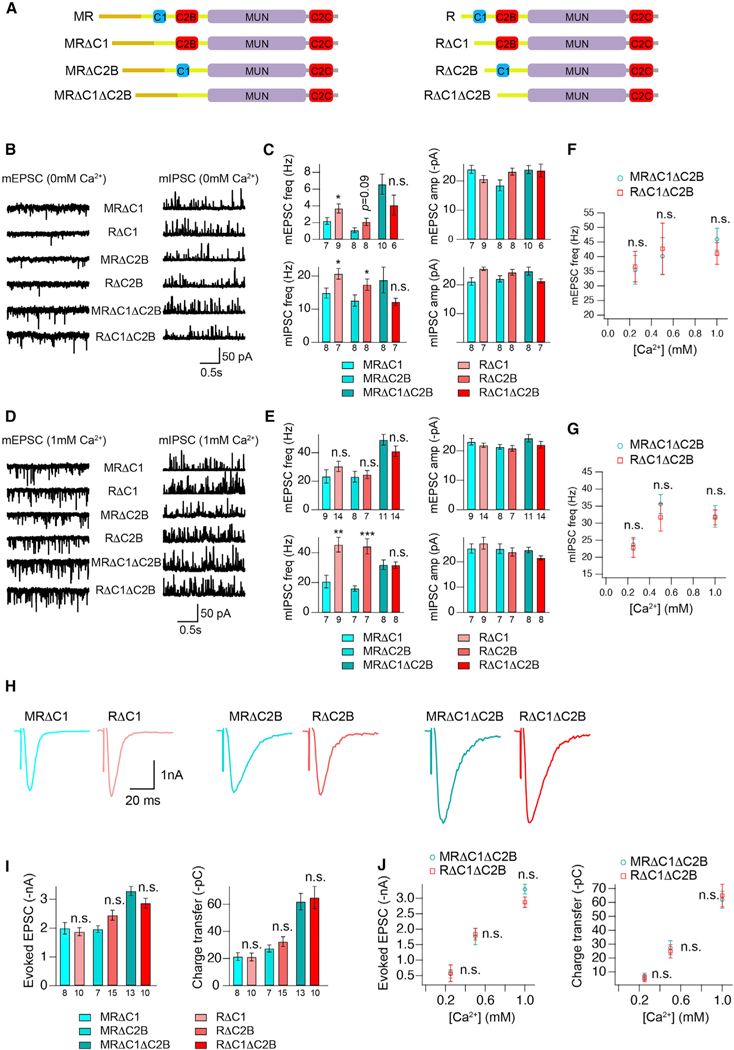
Figure 3. The inhibitory effects of the M domain are eliminated in the absence of the C1 and C2B domains.
(A) Cartoon depicting the domain structure of UNC-13MR and UNC-13R lacking their C1, C2B, or C1 and C2B domains. (B and D) Representative mEPSC and mIPSC traces (recorded at 0-mM and 1-mM Ca2+) from the indicated genotypes.
(C and E) Quantification of the frequency and amplitude of the mEPSCs and mIPSCs from the same genotypes as in (B) and (D).
(F and G) Comparison of the mEPSC and mIPSC frequency between MRΔC1ΔC2B- and RΔC1ΔC2B-rescued animals in various Ca2+ levels (0.25, 0.5, and 1 mM).
(H) Example traces of stimulus-evoked EPSCs from the indicated genotypes.
(I) Quantification of the evoked EPSC amplitude and charge transfer from the same genotypes as in (H).
(J) Comparison of the amplitude and charge transfer of the evoked EPSCs between MRΔC1ΔC2B- and RΔC1ΔC2B-rescued animals in various Ca2+ levels (0.25, 0.5, and 1 mM).
Data are means ± SEM. *p < 0.05, **p < 0.01, ***p < 0.001, n.s., non-significant when compared with the same C1 or C2B or C1 and C2B deletion in UNC-13MR; one-way ANOVA test for data in (C), (E), and (I), Student’s t test for data in (F), (G), and (J). The number of worms analyzed for each genotype is indicated under the bar graphs.

