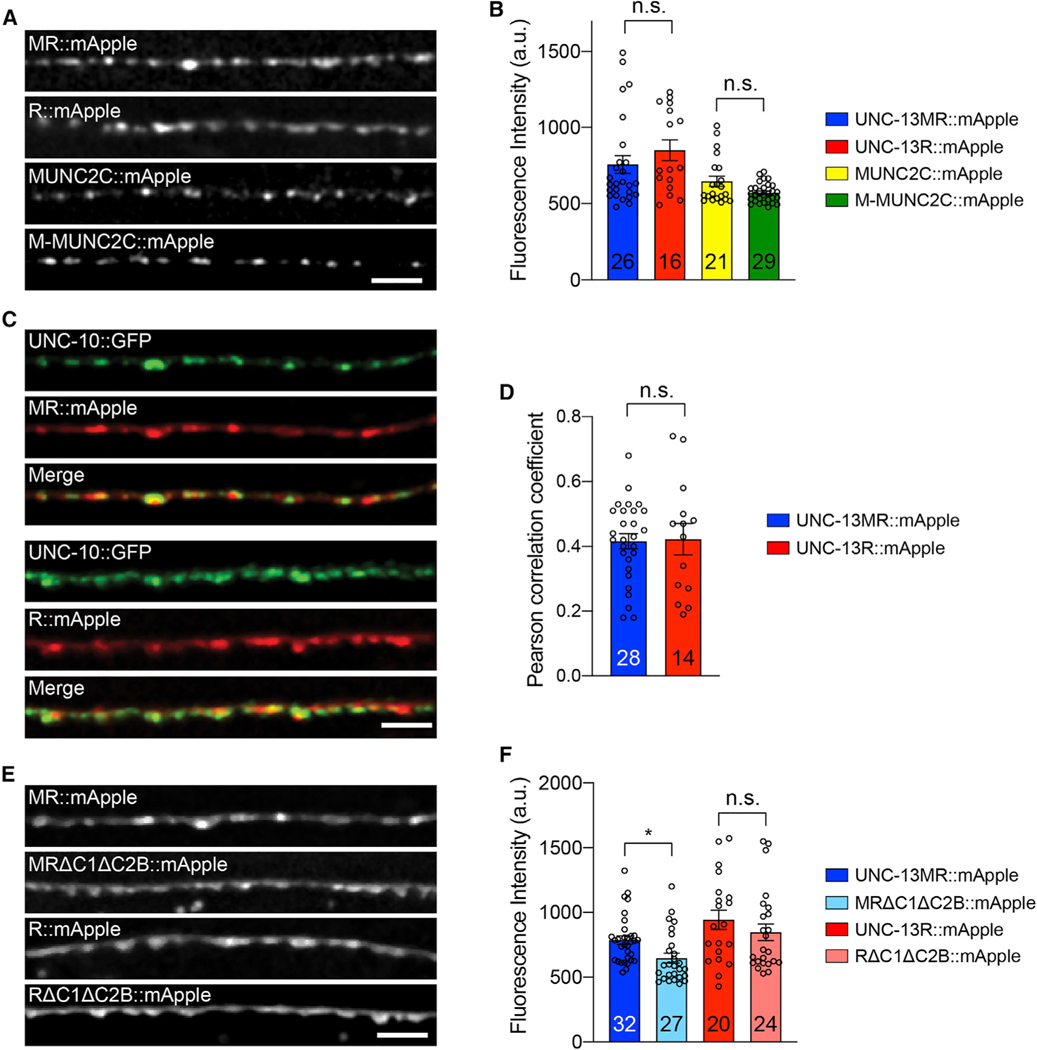
Figure 6. The M domain does not regulate UNC-13 protein level and localization.
(A) Representative confocal z stack images for mApple-tagged UNC-13MR, UNC-13R, MUNC2C, and M-MUNC2C (all driven by the unc-129 promoter). Scale bar, 5 μm.
(B) Quantification of the fluorescence intensity from the lines in (A).
(C) Representative confocal z stack images for UNC-13MR and UNC-13R (tagged with mApple), and their colocalization with UNC-10/RIM (tagged with GFP). Scale bar, 5 μm.
(D) Quantification of the Pearson correlation coefficient between UNC-13MR/UNC-13R and UNC-10.
(E) Representative confocal z stack images for UNC-13MR::mApple, MRΔC1ΔC2B::mApple, UNC-13R::mApple, and RΔC1ΔC2B::mApple.
(F) Quantification of the fluorescence intensity from the lines in (E).
Data are means ± SEM. *p < 0.05, n.s., non-significant, one-way ANOVA. The number of worms analyzed for each genotype is indicated in the bar graphs.

