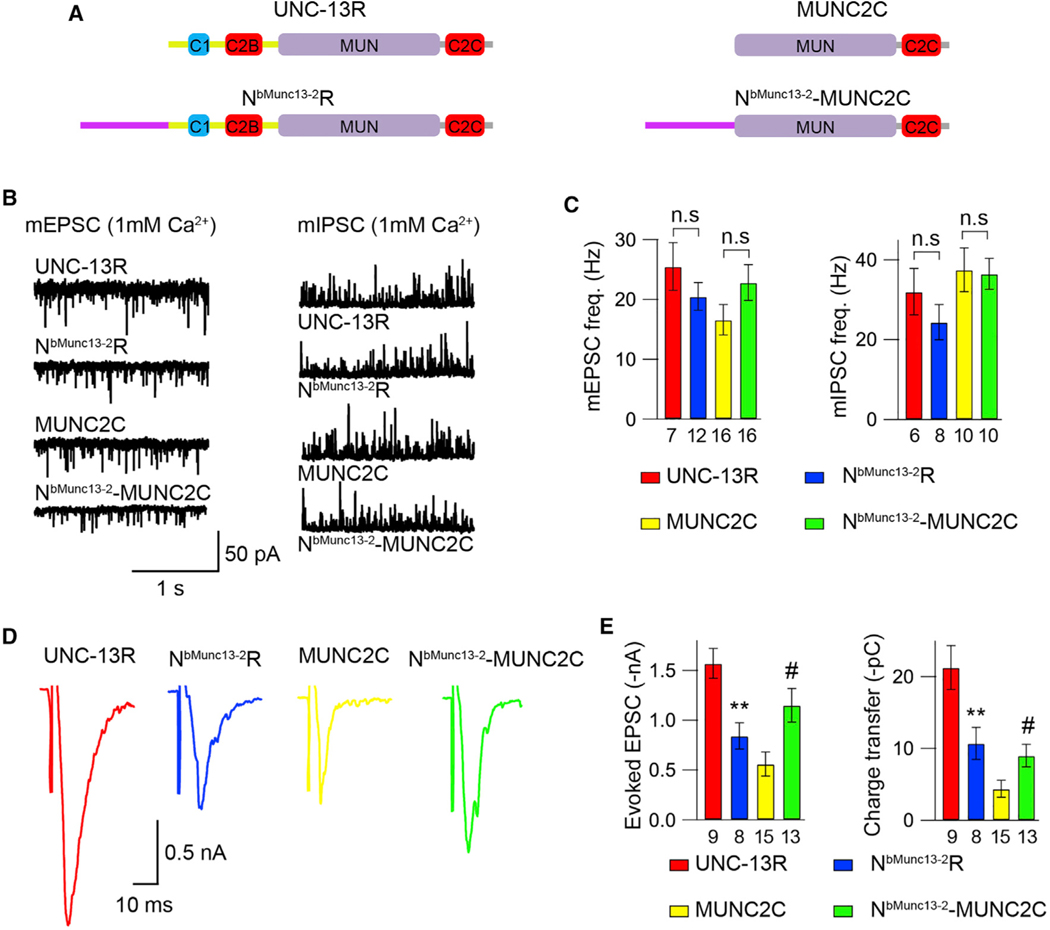
Figure 7. The N terminus in bMunc13–2 exhibits both inhibition and facilitation in synaptic transmission.
(A) Cartoon depicting the domain structure of UNC-13R, NbMunc13−2-R, MUNC2C, and NbMunc13−2-MUNC2C.
(B) Representative mEPSC and mIPSC traces (recorded in 1-mM Ca2+) from the indicated genotypes (UNC-13R, NbMunc13−2-R, MUNC2C, and NbMunc13−2-UNC2C rescue animals).
(C) Quantification of the frequency and amplitude of the mEPSCs and mIPSCs from the same genotypes as in (B).
(D) Example traces of stimulus-evoked EPSCs (recorded in 1mM Ca2+) from indicated genotypes.
(E) Quantification of the evoked EPSC amplitude and charge transfer from the same genotypes as in (D).
Data are means ± SEM. #p < 0.05 when compared with MUNC2C rescue; **p < 0.01 when compared with UNC-13R rescue; n.s., non-significant, one-way ANOVA. The number of worms analyzed for each genotype is indicated under the bar graphs.

