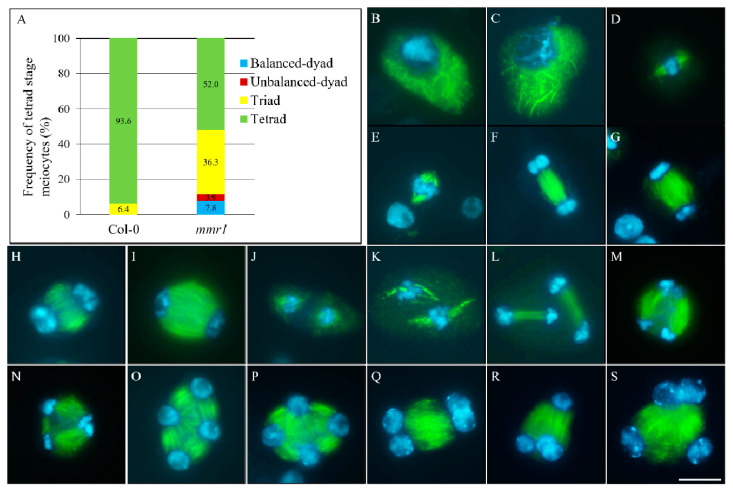
Figure 5.
Microtubular cytoskeleton structures in mmr1 meiocytes. (A) Histogram showing the frequency of tetrad stage meiocytes in mmr1. Numbers indicate the frequency of the corresponding phenotypes. (B–S) Prophase I- (B,C), metaphase I- (D,E), anaphase I- (F,G), interkinesis- (H,I), metaphase II- (J,K), telophase II- (L–N), and tetrad-stage (O–S) meiocytes in Col-0 (B,D,F,H,J,L,O) and the mmr1 mutant (C,E,G,I,K,M,N,P–S). Green, α-tubulin; cyan, DAPI. Scale bar = 10 µm.

