Figure 1.
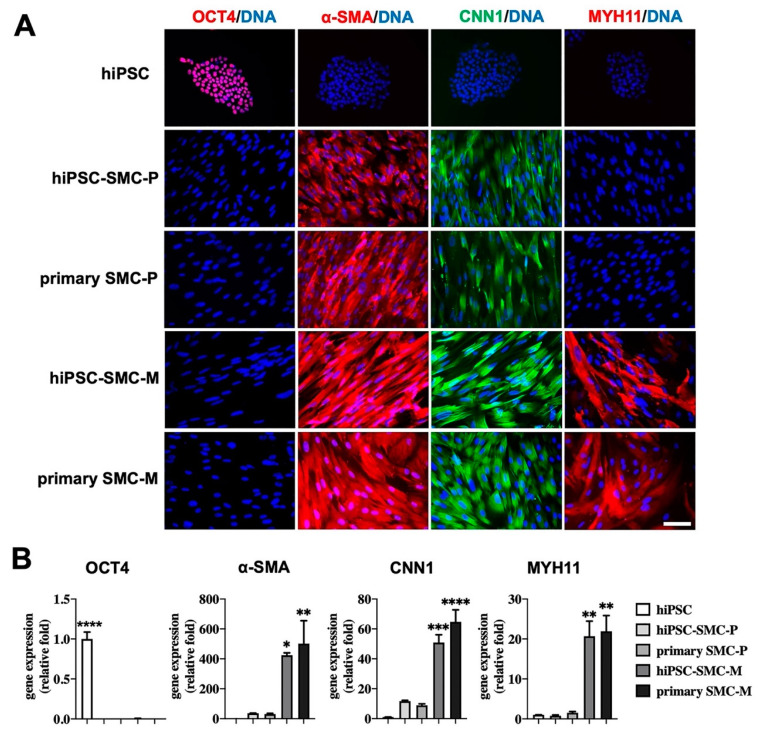
Characterization of hiPSC-SMC. (A) Immunofluorescence of the pluripotency marker OCT4 and the SMC-specific markers α-SMA, calponin 1 (CNN1) and smooth muscle myosin heavy chain 11 (MYH11) in hiPSC, proliferative hiPSC-SMC (hiPSC-SMC-P), proliferative primary human SMC (primary SMC-P), mature hiPSC-SMC (hiPSC-SMC-M), and mature human SMC (primary SMC-M). Scale bar, 200 μm. (B) Bar graphs show qPCR analysis of relative transcript numbers of OCT4 and SMC-specific marker genes in hiPSC, hiPSC-SMC-P, primary SMC-P, hiPSC-SMC-M, and primary SMC-M. Values on the y-axis represent fold changes relative to number of human GAPDH transcripts; gene expression is relative to that in hiPSC (ANOVA with Tukey’s multiple comparisons test); n = 3. * p < 0.05; ** p < 0.01; *** p < 0.001; **** p < 0.0001.

