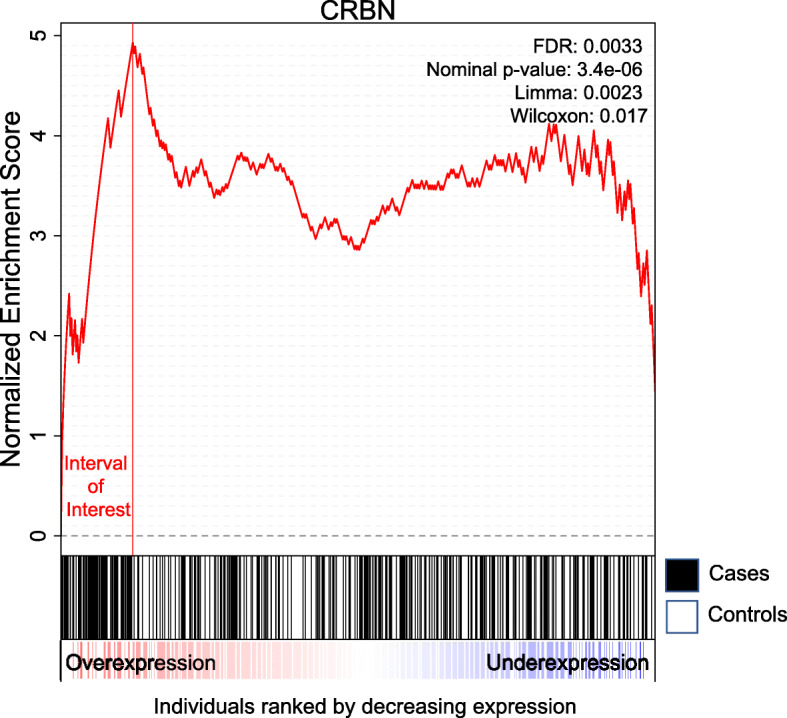
Fig. 1.

Example of a computed enrichment score. All individuals were ranked by decreasing expression of the CRBN gene. The x axis corresponds to the ranked individuals. In the second panel, cases correspond to black vertical bars and controls are white vertical bars. The enrichment score goes up whenever we encounter a case and goes down whenever we encounter a control. The maximum standardized score reached is 4.93 and corresponds to an uncorrected p value of 3.4E −06 and FDR of 0.003 for our test. There are 52 cases (19% of all cases) and 9 controls (4% of all controls) among the individuals to the left of the maximum. This was taken from the Alzheimer data in the “Alzheimer and Parkinson disease” section and it corresponds to the CRBN expression distribution. Note that Limma and Wilcoxon do not detect this gene as significant when simultaneously testing all 25,000 genes (uncorrected p values are respectively 0.002 and 0.01)
