Fig. 7.
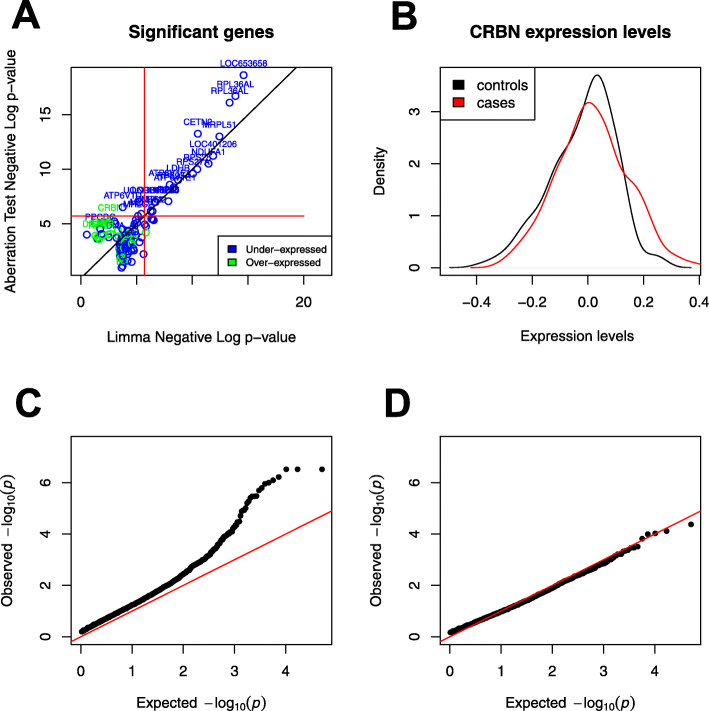
Results on Alzheimer’s disease. a Genes differentially expressed or aberration enriched in Alzheimer versus healthy controls, discovered using our test versus Limma. The genes that have FDR≤0.1 for either method are plotted. Gene names are added for all the significant genes by our method and the top 10 heterogeneous associations (r≤0.3). Red lines correspond to the Bonferroni significance threshold. b Distribution of expression levels in cases and controls for the gene CRBN discovered by our test. c QQ plot of the p values returned by our test on the Alzheimer data. d QQ plot of the p values returned by our test after randomly permuting the samples

