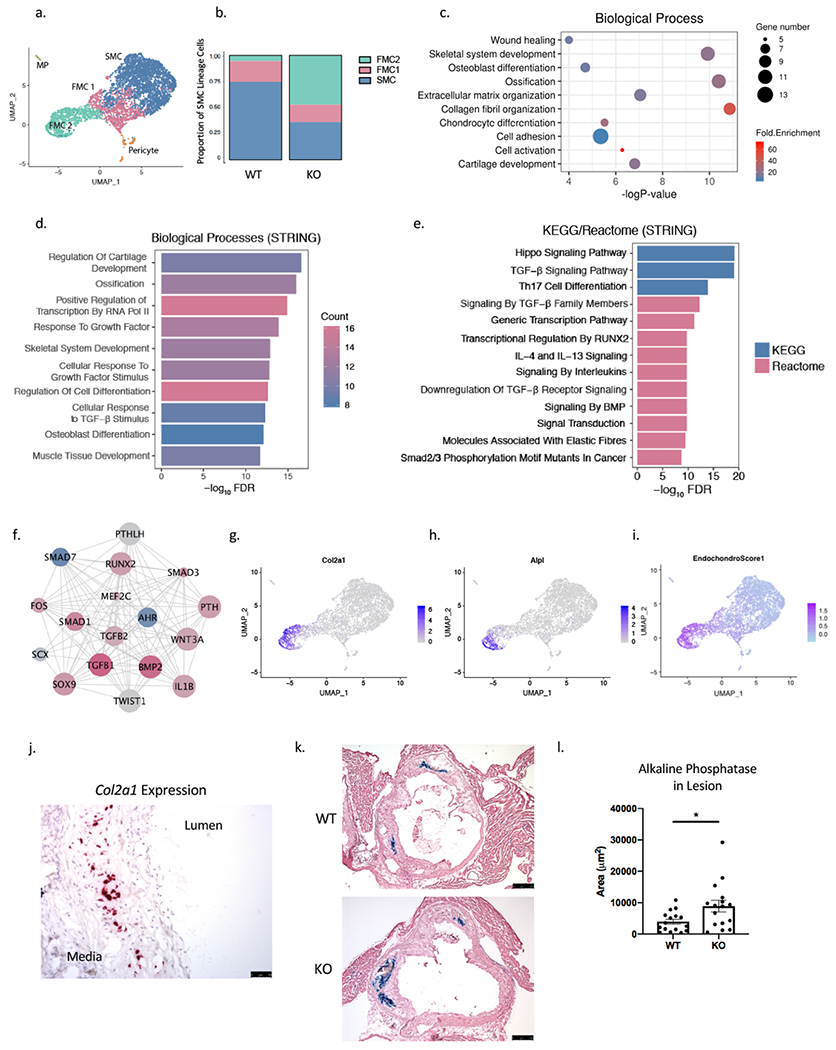
Figure 4. SMC-specific Ahr KO produces modulated cells with a chondrogenic phenotype.

(a) On the combined UMAP of tdTomato+ lineage traced cells from WT and KO mice, the FMC population was further clustered to FMC1 and FMC2 population based on graph-based clustering with PCA. (b) The proportion of FMC2 cells was significantly greater for the KO compared to the WT group (Chi-square p = 4.9e-262). (c) DAVID Gene Ontology analysis of the top 100 differentially regulated genes in FMC2 compared to FMC1 population. (d) Enriched biological pathways and (e) KEGG/Reactome from the top upstream regulators of FMC1 to FMC2 transcriptional change. (f) A network of top upstream regulators of FMC2 vs. FMC1 transcriptional phenotype show AHR as top inhibited upstream factor (blue = inhibited, red = activated, size of circle = Z-score; nodes from Ingenuity Pathway Analysis, edges from STRING-db). (g) The FMC2 population was enriched for expression of chondrocyte/osteoblast markers Col2a1 (h) and Alpl, and (i) an endochondral score built from the average expression of 13 genes show a strong signal in the FMC2 population. (j) RNAscope of Col2a1 expression, which is localized to the neointimal layer of the atherosclerotic lesion in mouse aortic sinus. (k) Alkaline phosphatase activity is detected in the neointima of atherosclerotic lesion at 16 weeks of HFD, in both WT and KO (bar = 250μm). (l) The average lesion area with alkaline phosphatase activity is larger in KO group compared to the WT group (3936±794 vs. 8893±1850 μm2, p=0.02. *P < 0.05.
