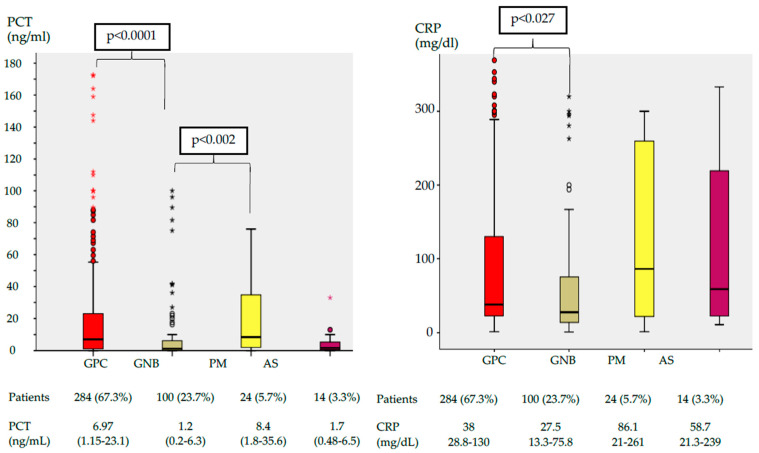
Figure 2.
Box plot of serum PCT and CRP concentration by pathogen group. The center of each box plot represents the median, with the box denoting the IQR, the whiskers representing 1.5 times the IQR, and dots showing outliers beyond the whiskers. Data are expressed as numbers (%) and medians (IQR). Abbreviations: PCT, procalcitonin; CRP, C-Reactive protein; GPC, Gram Positive bacteria cocci; GNB, Gram Negative bacteria bacilli; PM, polymicrobial; AS, Aspergillus; IQR, interquartile range.

