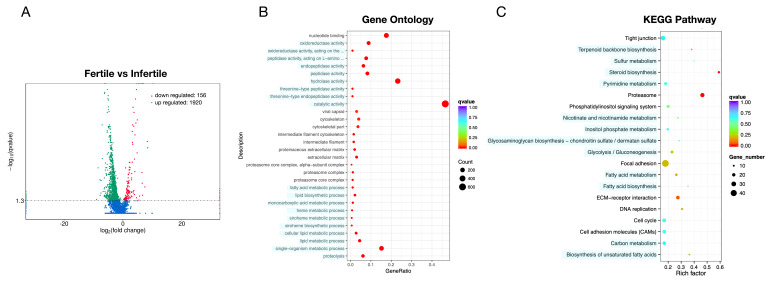
Figure 2.
Volcano plot and Gene Ontology (GO)/pathway analysis of differentially expressed (DE) microRNAs (mRNAs) between infertile and fertile group in Paralichthys olivaceus. (A) Volcano plot of DE mRNAs. The red spots, green spots, and blue spots separately represent down-regulated, up-regulated, and undifferentiated mRNAs. (B) Histogram of Gene Ontology (GO) enrichment of mRNAs. (C) Top 20 significantly changed mRNA pathways.

