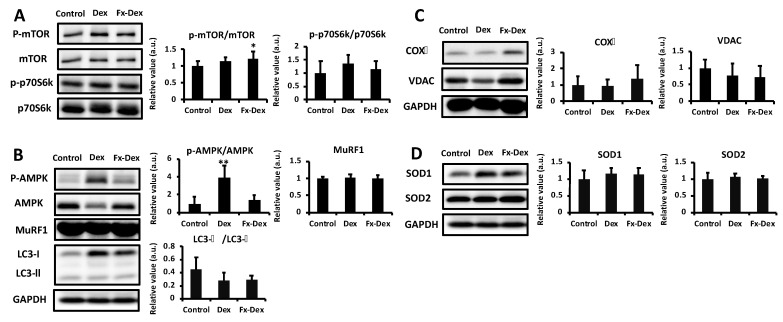
Figure 4.
Fx inhibited Dex-induced phosphorylation of AMPK in gastrocnemius muscle. The graph shows the expression of protein synthesis-related proteins (A), degradation-related proteins (B), mitochondria-related proteins (C), and antioxidant enzymes (D). Values represent the mean ± S.D. (n = 5–7). All protein expression levels were normalized to the GAPDH levels. Protein is expressed relative to the value of the control protein levels. Significant differences were determined by Dunnett’s test (* p < 0.05, ** p < 0.01).

