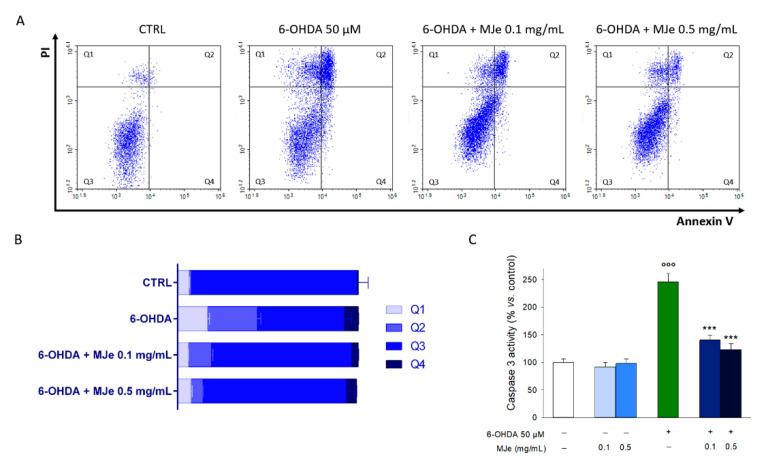
Figure 3.
MJe mitigated the apoptosis induced by 6-OHDA in SH-SY5Y cells. (A) Evaluation of apoptosis was performed cytofluorimetrically by the Annexin V/PI test. Representative Annexin V vs. PI dot plots are shown, where necrotic, late apoptosis, viable cells, and early apoptosis cells are in Q1, Q2, Q3 and Q4, respectively. (B) The histogram shows the percentage of cells in each quadrant, representing the mean ± SEM of three different experiments in triplicate (N = 9). (C) Data of caspase 3 activity are presented as the mean of three experiments ± SEM in triplicate (N = 9). °°° p < 0.001 vs. control; *** p < 0.001 vs. 6-OHDA 50 µM.

