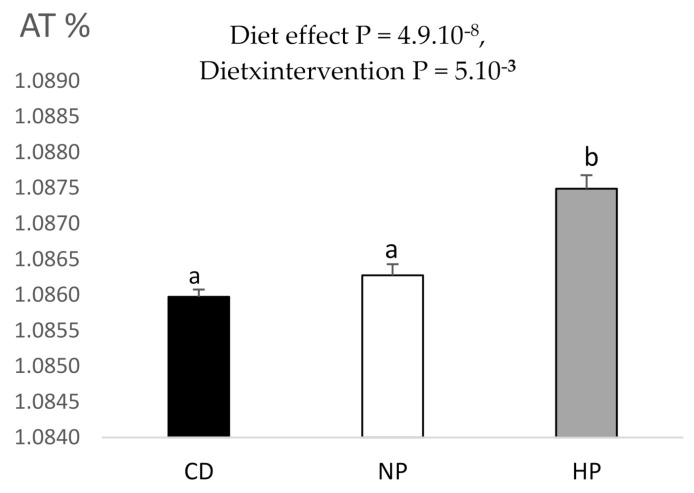
Figure 7.
13C enrichment observed in 24 h urines of participants. Data are mean ± SEM. The p value is indicated on the graph, when the difference is significant, for the diet and period effect (ANOVA). When the effect is significant, different letters indicated significant differences between groups. CD, control diet; NP, normal protein, high-fat, hypercaloric diet diet; HP, high-protein, high-fat, hypercaloric diet.

