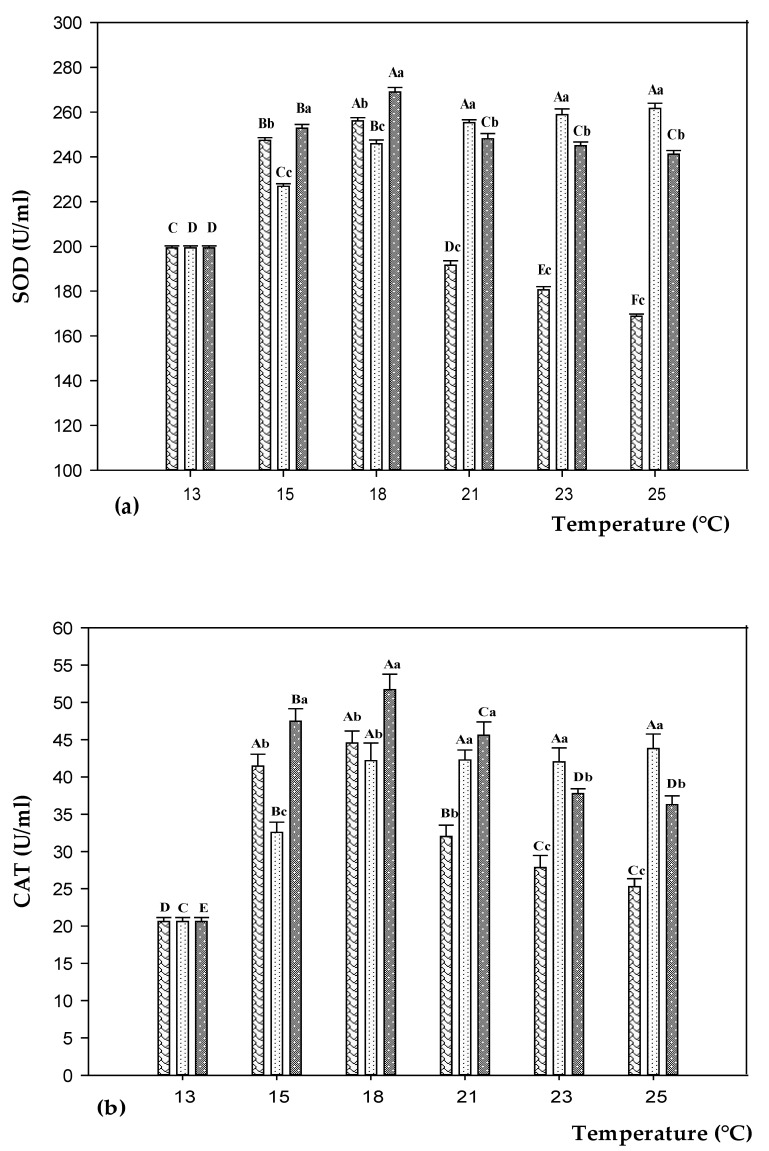
Figure 3.
SOD (a) and CAT (b) levels in sea bass fed on control diet (CD,  ) and experimental diets with different concentration of oregano essential oil: 100 ppm (D100,
  ) and 200 ppm (D200,
  ) and, exposed to different water temperature (13, 15, 18, 21, 23, and 25 °C). Data are reported as means ± standard deviations (at each temperature value, n = 12 per treatment). Different capital letters (A–F) indicate significant differences (p < 0.05) among water temperature within the same diet. Different lowercase letters (a–c) indicate significant differences (p < 0.05) among diets within the same water temperature.

