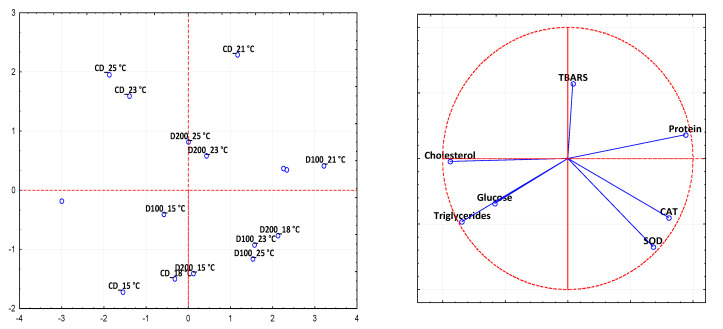
Figure 7.
Score (a) and loading (b) plots of first and second principal components after principal component analysis performed on oxidative stress biomarkers and serum biochemical parameters in sea bass fed on control diet (CD) and experimental diets with different concentration of oregano essential oil (100 ppm (D100) and 200 ppm (D200)) and, exposed to different water temperatures (13, 15, 18, 21, 23, and 25 °C).

