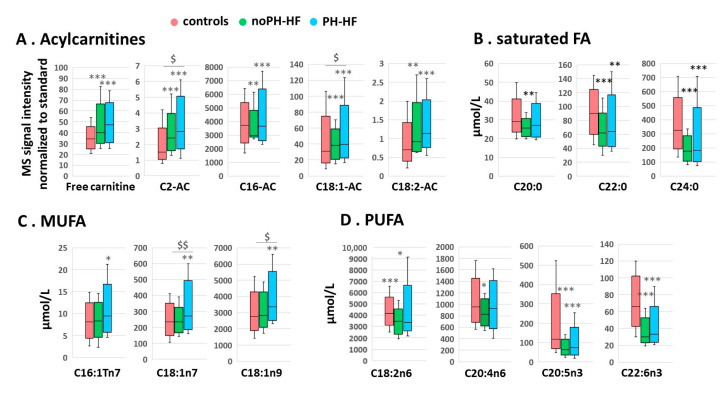
Figure 2.
Acylcarnitines and fatty acids circulating levels are differentially affected in PH-HF (n = 33) and noPH-HF (N = 27) compared to controls (N = 72). Box plots represent top discriminant FA-related metabolites identified using the PCA analysis in the comparison noPH-HF (green) vs. controls (red) and PH-HF (blue) vs. controls. Shown are semi-quantitative analyses of (A) acylcarnitines reported as MS signal ratio normalized to standard, and the quantitative analysis of (B) saturated FA, (C) MUFA, and (D) PUFA. In the boxplots, rectangles represent the SD, the segment inside the rectangle the median and the whiskers above and below the maximum and minimum. * p < 0.05, ** p < 0.01, *** p < 0.001 compared to controls; $ p < 0.05, $$ p < 0.01 PH-HF vs. noPH-HF. Other more commonly measured metabolites are shown in Figure S1.

