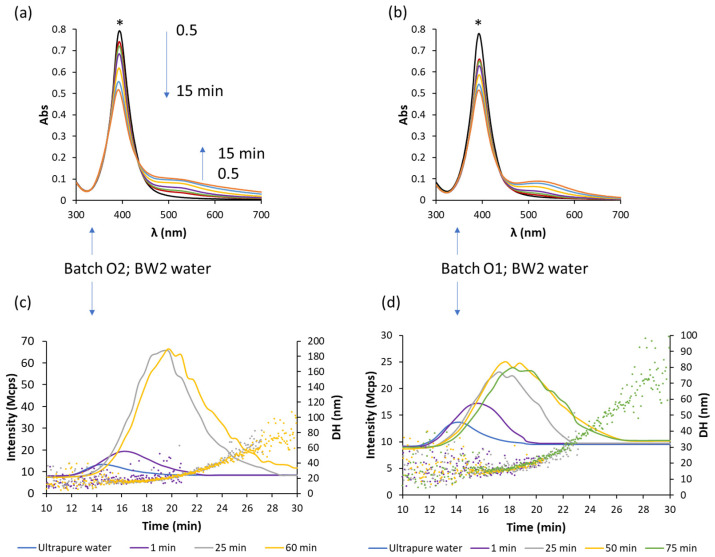
Figure 3.
Spectra of batches O2 (a) and O1 (b) diluted 1/4 with bottled mineral water measured at several times (0.5, 1, 2, 5, 10, 15 min, the SPR band for the dilution with ultrapure water was also included, marked with *) and their fractograms (solid lines) (c) and (d), respectively, by using dynamic light scattering (DLS) and hydrodynamic diameter (points) measured at different times.

