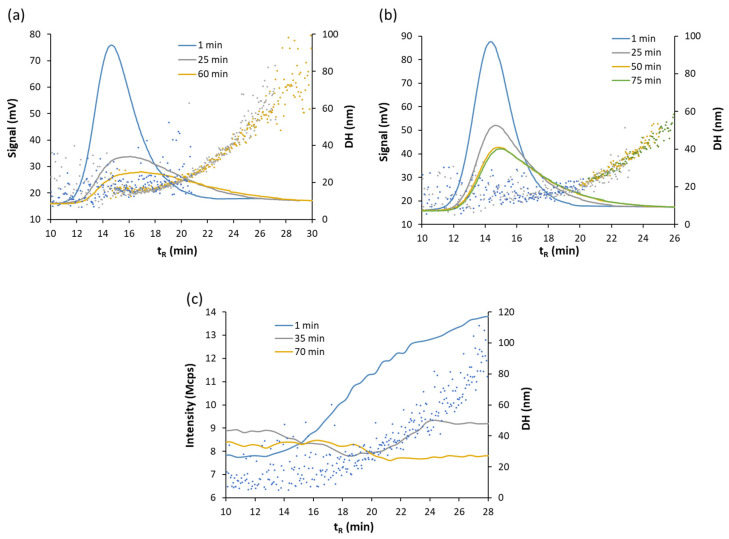
Figure 6.
Fractograms (solid line) and hydrodynamic diameter (points) obtained for suspension of batches O2 (a) and O1 (b) diluted 1/4 with BW2 water at different times using UV-Vis detector. (c) Fractograms and hydrodynamic diameter for suspension of batch O2 diluted 1/4 with BW1 water at different times using the DLS signal.

