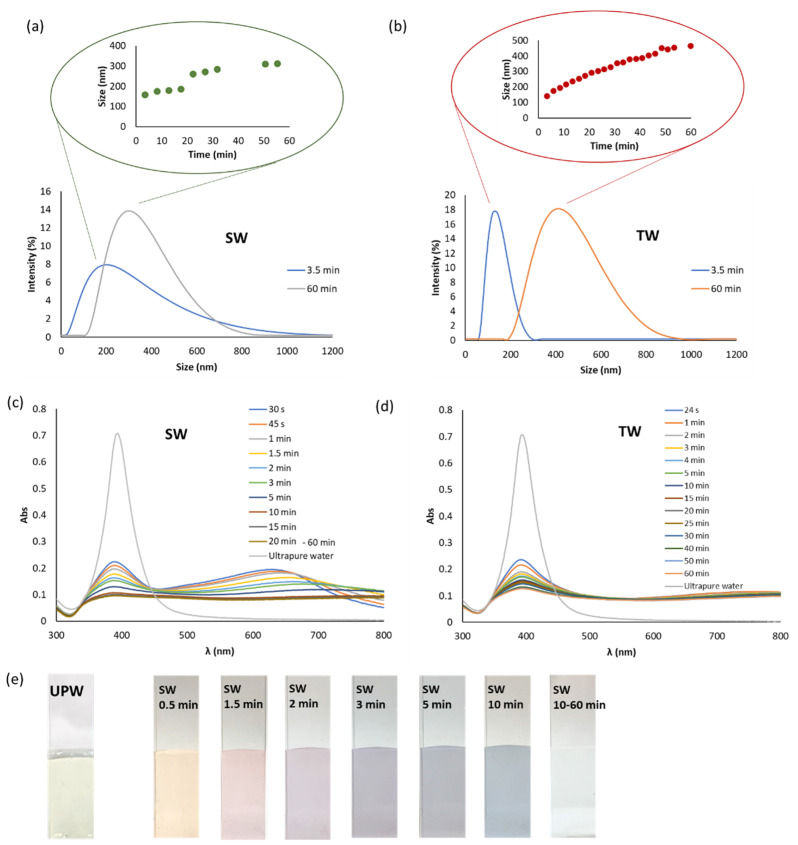
Figure 8.
Static DLS and UV-spectroscopy results for batch O2 diluted 1/4 with sea (SW) and tap (TW) waters measured at several times: (a) DLS registers for SW at different times including an insert, which shows the changes in size of AgNPs with time ; (b) DLS registers for TW at different times including an insert, which shows the changes in size of AgNPs with time; (c) Spectra of AgNPs with SW at several times, the SPR band for the dilution with ultrapure water was also included; (d) Spectra of AgNPs with TW at several times, the SPR band for the dilution with ultrapure water was also included; (e) Colour of the suspension in SW with time.

