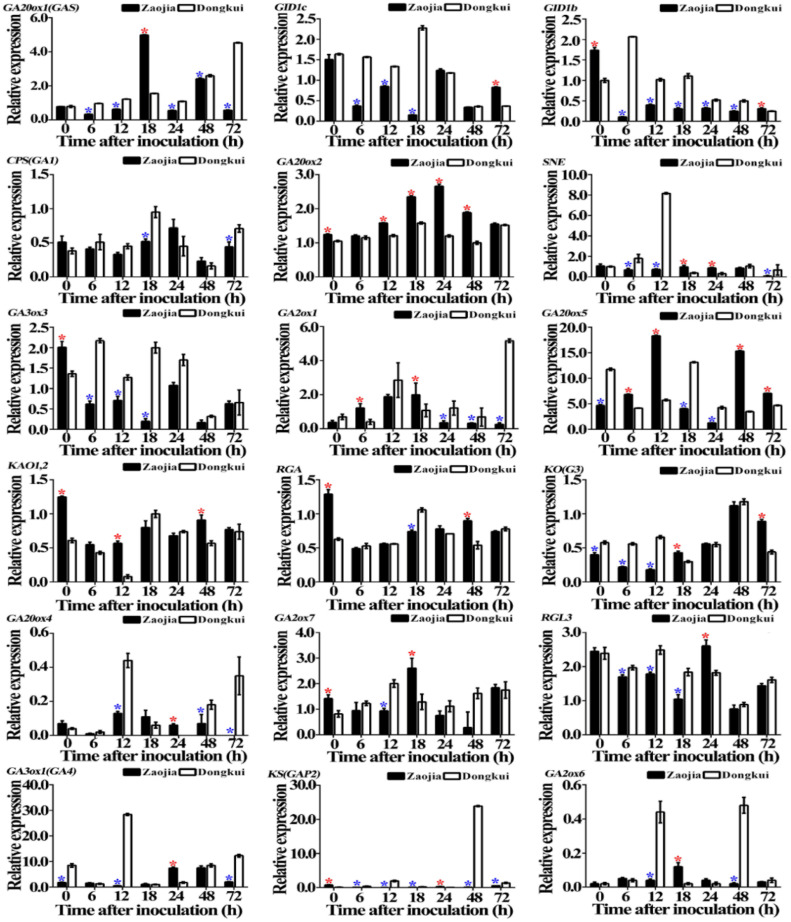
Figure 7.
Relative expression of gibberellin signaling pathway-related genes in leaves of resistant (Zaojia) and susceptible (Dongkui) bayberry cultivars following the infection of twig blight pathogen. Data were analyzed by one-way analysis of variance (ANOVA) with least significant difference (LSD) posthoc test. These values are the mean of three repetitions ± standard error of the means. The asterisk (*) in red and blue over bars represent the significant (p < 0.05) upregulation and downregulation, respectively, in the expression of one gene in resistant cultivar relative to the susceptible cultivar. MrUBQ1 was used as the internal reference gene.

