Figure 1.
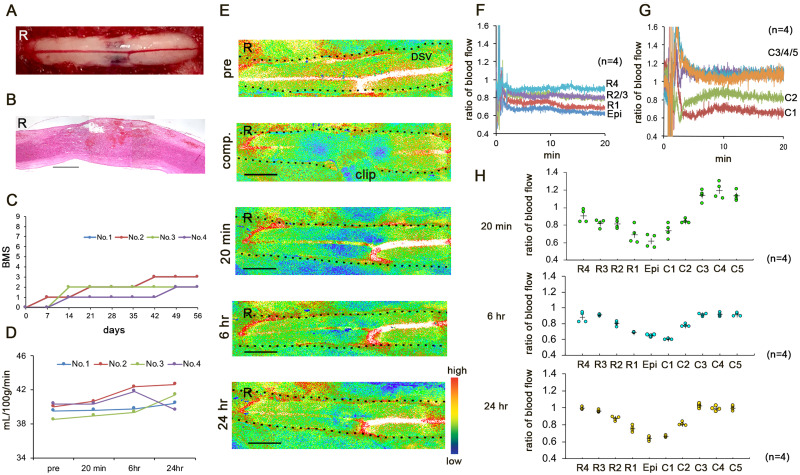
(A–C) The thoracic compression injury model. (A) Representative image obtained 20 min after decompression. (B) Haematoxylin and eosin staining in the mid-sagittal section 24 h after SCI. R, rostral. Scale bar = 1 mm. (C) Basso Mouse Scale scores up to 8 weeks after SCI. Error bars represent the mean±SD. (D–H) Real-time blood flow distributions in early SCI. (D) Blood flow values at 5-mm rostral from the epicentre before SCI (pre-SCI) and 20 min, 6 h, and 24 h after SCI. Error bars represent the mean±SD. (E) Representative speckle contrast images of the spinal cord obtained before SCI (pre-SCI), during compression, and 20 min, 6 h, and 24 h after SCI. The dotted lines indicate the border of the spinal cord. R, rostral; DSV, dorsal spinal vein. Scale bar = 2 mm. (F and G) The mean ratio of the blood flow at the rostral/caudal points from the epicentre 20 min after SCI. (H) The ratio of the blood flow 20 min, 6 h and 24 h after SCI. R/C1, 2, 3, 4, and 5 are located 1, 2, 3, 4, and 5 mm rostral and caudal from the epicentre, respectively. Data were analysed using the Kruskal–Wallis test along with Dunn’s post hoc test. Plus marks represent the mean. (n = 4).

