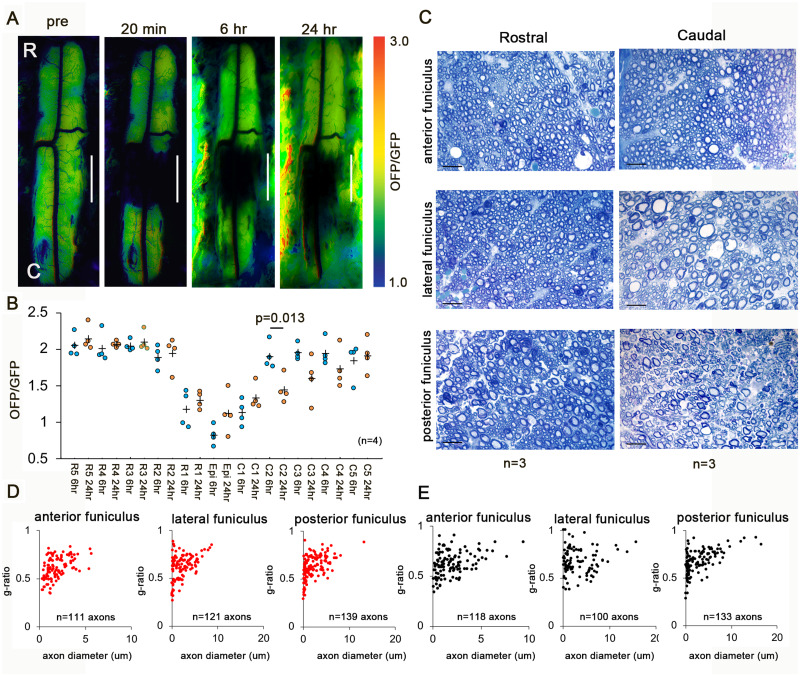
Figure 6.
Rostro-caudal differences in degeneration in early SCI after 2-DG treatment. (A) Representative intracellular ATP images before and 20 min, 6 h, and 24 h after SCI with 2-DG administration. (B) The intracellular ATP levels at 6 and 24 h after SCI. The maximum OFP/GFP value at 3.0 and the minimum value at 1.0. Data were analysed using Wilcoxon’s signed-rank test and the Kruskal–Wallis test along with Dunn’s post hoc test. Plus marks represent the mean. (n = 4). (C) Representative images in white matter cross-sections 24 h after SCI at 3 mm rostral and caudal from the epicentre. Scale bar = 10 um. (D and E) Scatterplot of g-ratio versus axon diameter in white matter cross-sections at 3 mm rostral (D) and caudal (E) from the epicentre. (n = 3). Data were analysed using Wilcoxon’s signed-rank test and the Kruskal–Wallis test along with Dunn’s post hoc test.

