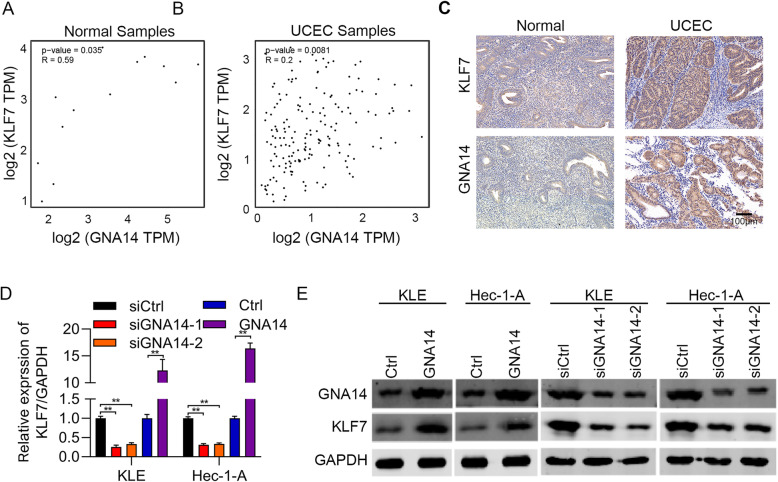
Fig. 1.
GNA14 upregulates KLF7 in UCEC. a and b The correlation between GNA14 expression and KLF7 expression was analyzed in normal samples (A, R = 0.59, p = 0.035) and UCEC samples (B, R = 0.2, p = 0.0081) from TCGA database. c IHC staining of GNA14 and KLF7 in UCEC (n = 20) and normal (n = 15) samples. Left, representative images of IHC staining. Right, quantification results of GNA14 and KLF7 in cancer and normal tissues. Spearman correlation between KLF7 and GNA14 was analyzed in cancer and normal samples based on IHC staining. d and e qRT-PCR (d) and immunoblotting (e) analysis of GAN14 and KLF7 in GAN14 knockdown and overexpressed Hec-1-A and KLE cells. GAPDH acts as the internal control. **p < 0.01

