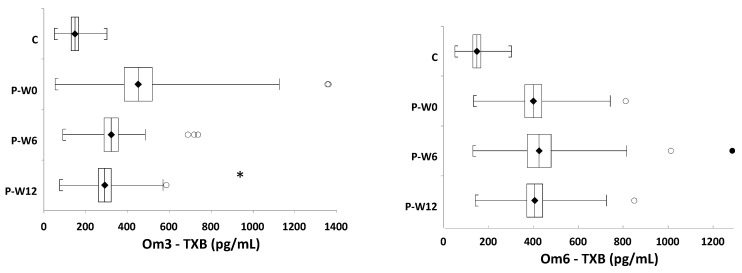
Figure 2.
The levels of TXB in healthy controls and in patients with depressive disorder, during the intervention. C = controls, P = patients, Om3 = omega-3 patient intervention group, Om6 = omega-6 patient intervention group, TXB = thromboxane B, W = week of the intervention; • outer fence for outlier, ° inner fence for outlier, * p < 0.05 with respect to W0.

