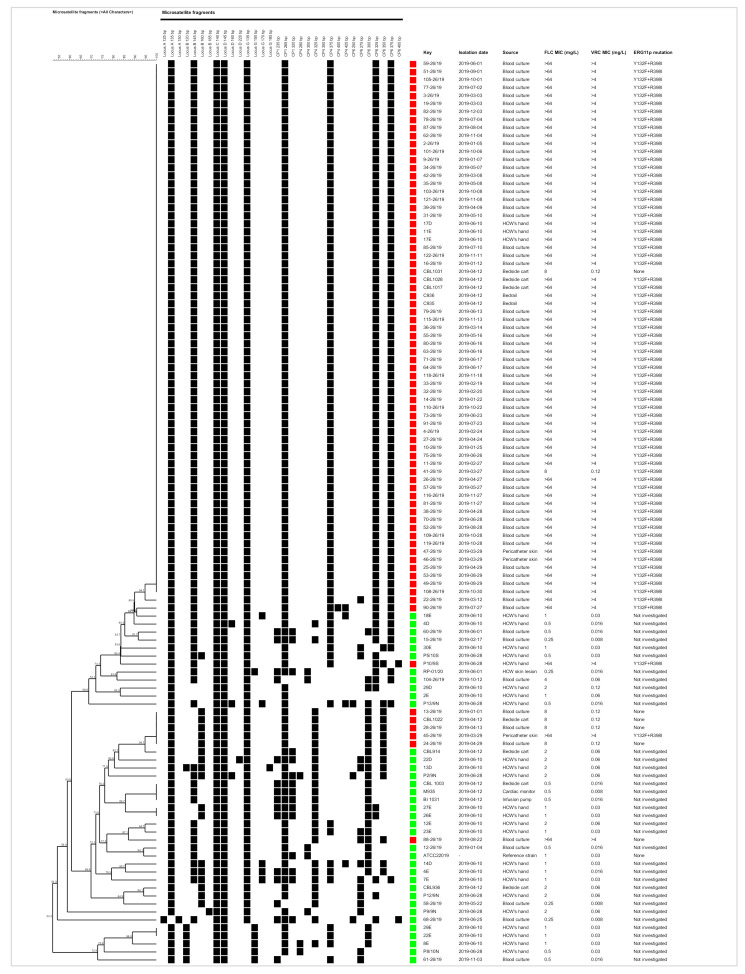
Figure 4.
Dendrogram showing the clustering of the 112 C. parapsilosis sensu stricto isolates and the ATCC22019 strain based on microsatellite analysis. The black square indicates the presence of an amplification product, the red square indicates the azole-resistant isolates, and the green square indicates the non-azole-resistant ones. FLC = fluconazole, VRC = voriconazole, and MIC = minimum inhibitory concentration.

