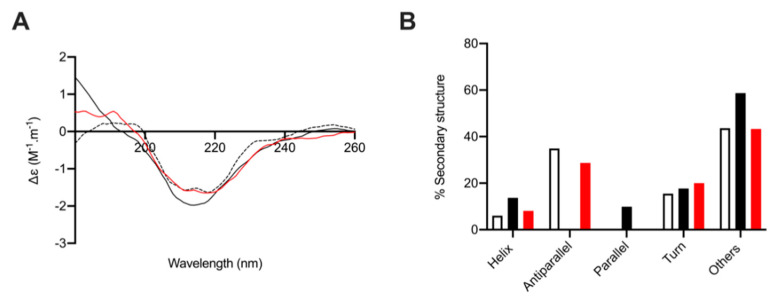
Figure 10.
The secondary structural change of BACE1 observed in the presence of heparin and L. vannamei F4. (A) CD spectra of BACE1 alone (9 µg; dashed line) and in the presence of 36 µg heparin (black solid line) or L. vannamei F4 (red) in 50 mM Sodium acetate buffer pH 4.0. (B) Secondary structure (%) of BACE1 alone (white) and in the presence of heparin (black solid line) or L. vannamei F4 (red), estimated using BeStSel [45] between 180–260 nm.

