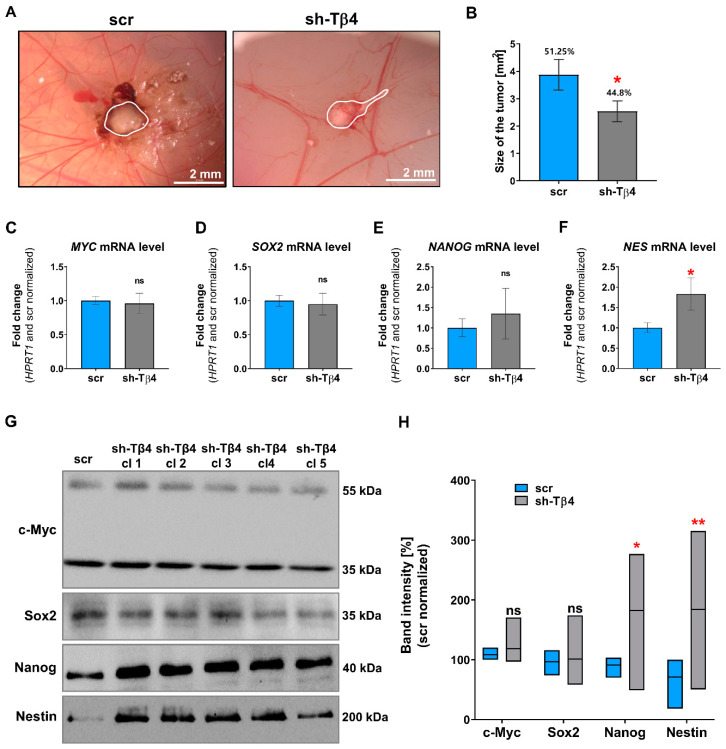
Figure 3.
Evaluation of tumorigenic potential and level of stemness markers for the cells with lowered Tβ4 level. (A,B) The chorioallantoic membrane (CAM) model was used to estimate in vivo tumor formation by scr and sh-Tβ4 cells. (A) Representative microscopic images. Tumors were outlined with a white line. (B) Quantitative analysis of tumors and their size. For the sake of the estimation of cells’ ability to form tumors, we engrafted the cells on 33 and 38 embryos in the case of scr and sh-Tβ4 cells, respectively. To evaluate the size of tumors, 17 tumors for both types of clones were measured. The graph indicates the mean ± SEM. The results presented separately for every clone are shown in Supplementary Figure S2. (C–H). Analysis of the expression of stemness-related markers (c-Myc, Sox2, Nanog, Nestin) in scr and shTβ4 cells (n = 3). (C–F) qPCR analysis of MYC, SOX2, NANOG, and NES expression (n = 3). The HPRT1 gene was used for the normalization. The graphs indicate the mean ± SD. The results presented separately for every clone are shown in Supplementary Figure S3. (G) Representative immunoblots of tested stemness-related markers. Thirty micrograms of protein were loaded on every lane. Membranes were probed for chosen stemness marker proteins: c-Myc, Sox2, Nanog, and Nestin. Corresponding Ponceau S membrane stainings are shown in Supplementary Figure S4A. (H) Densitometric analysis of c-Myc, Sox2, Nanog, and Nestin Western blots (n = 3). The significance level was set at * p < 0.05, ** p < 0.01. Graphs indicate average-max-min values. The results presented separately for every clone are shown in Supplementary Figure S4B.

