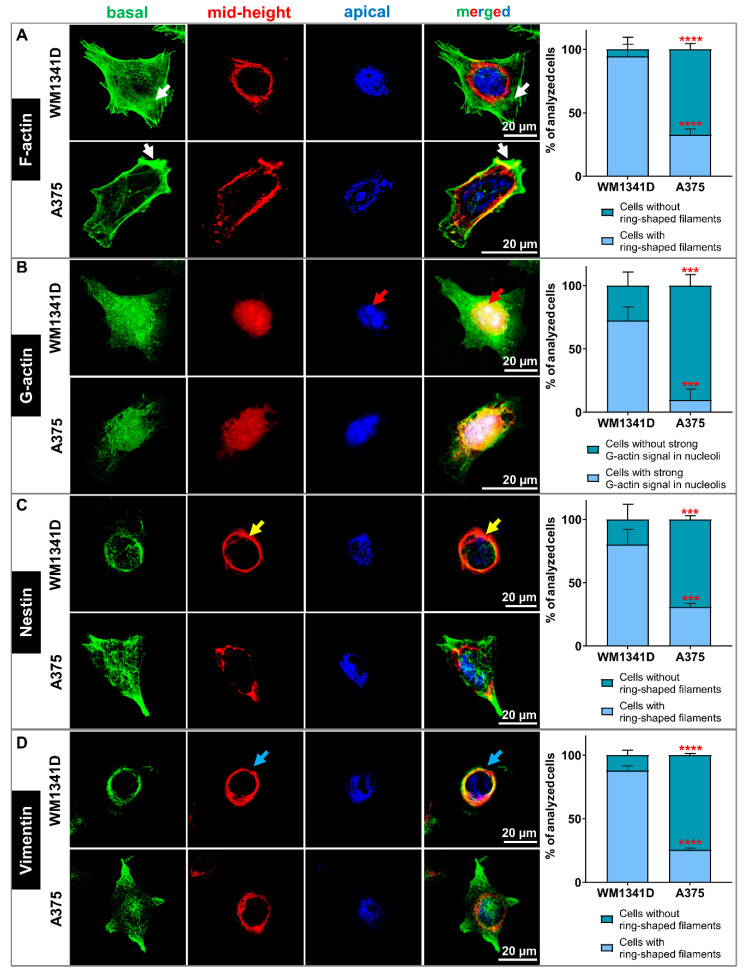
Figure 5.
The actin cytoskeleton and organization of Nestin and Vimentin filaments in WM1341D and A375 cells. (A–D) Immunocytochemical stainings to detect selected cytoskeleton components in WM1341D and A375 cells. The confocal microphotographs pictures for each cell were captured at three focal planes: cell contact area to the substratum (basal—green), a cross-section of the cell nucleus (mid-height—red), and nucleus apical outer surface (apical—blue). Finally, the photos were merged into a single image. (A) Detection of filamentous actin (F-actin). White arrows indicate stress fibers. (B) Visualization of monomeric actin (G-actin). Red arrows point at the denser aggregation of G-actin in nucleoli. (C) Detection of subcellular localization of Nestin. Yellow arrows indicate a ring-shaped localization around the nucleus. (D) Immunocytochemical staining to detect Vimentin. Blue arrows indicate a ring-shaped structure around the nucleus. Separated microphotographs with additional F-actin and cell nucleus visualization are presented in Supplementary Figures S9A, S11A and S13A for G-actin Nestin- and Vimentin-staining, respectively. In the case of Supplementary Figures S10A, S12A, and S14A, population photos are presented. We quantified our observations and presented the data in the form of graphs indicating the mean ± SD. At least 30 cells from 3 population photos per condition were analyzed. The significance level was set at *** p < 0.001, and **** p < 0.0001.

