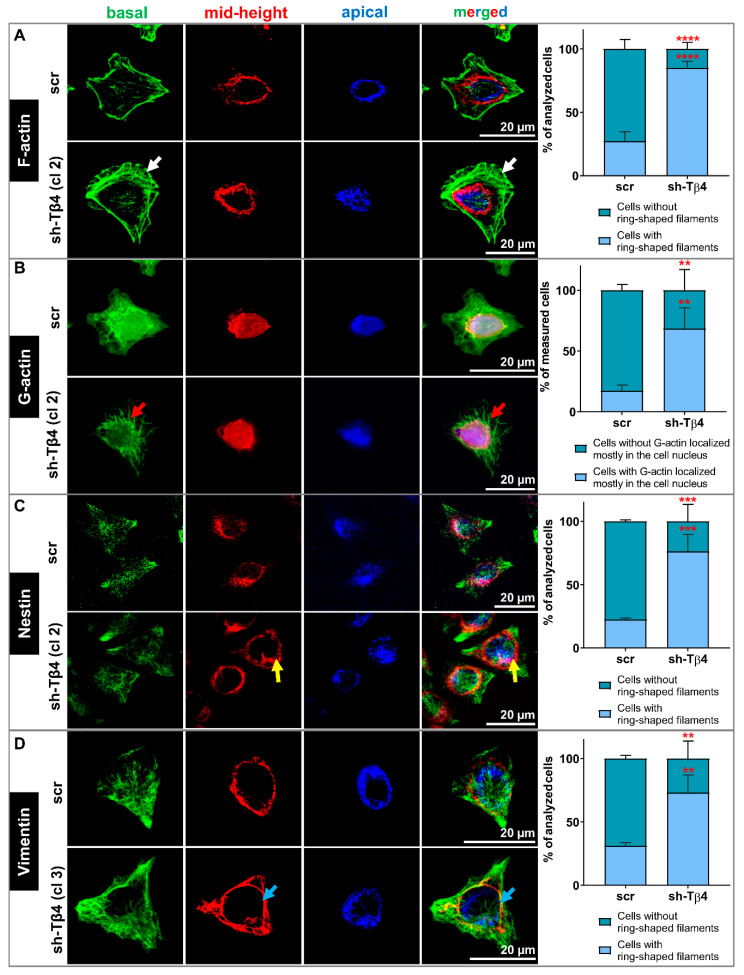
Figure 6.
The role of Tβ4 in the actin cytoskeleton and organization of Nestin and Vimentin filaments in scr and sh-Tβ4 cells. (A–D) Immunocytochemical stainings to detect selected cytoskeleton components in scr and shTβ4 cells. The confocal microphotographs pictures for each cell were captured at three focal planes: cell contact area to the substratum (basal—green), a cross-section of the cell nucleus (mid-height—red), and nucleus apical outer surface (apical—blue). Finally, the photos were merged into a single image. (A) Detection of filamentous actin (F-actin). White arrows indicate stress fibers. (B) Visualization of monomeric actin (G-actin). Red arrows indicate the denser aggregation of G-actin in the cytoplasm. (C) Detection of subcellular localization of Nestin. Yellow arrows indicate a ring-shaped localization around the nucleus. (D) Immunocytochemical staining to detect Vimentin. Blue arrows indicate a ring-shaped structure around the nucleus. Separated microphotographs with additional visualization of F-actin and cell nucleus are presented in Supplementary Figures S9B-B’’ and S10B-B’; S11B-B’’ and S12B-B’; S13B-B’’ and S14B-B’ for G-actin, Nestin- and Vimentin-staining, respectively. In the case of Supplementary Figures S10B–B’, S12B-B’, and S14B-B’ population photos are presented. We quantified our observations and presented the data in the form of graphs indicating the mean ± SD. At least 30 cells from 3 population photos per condition were analyzed. The significance level was set at ** p < 0.01, *** p < 0.001, and **** p < 0.0001.

