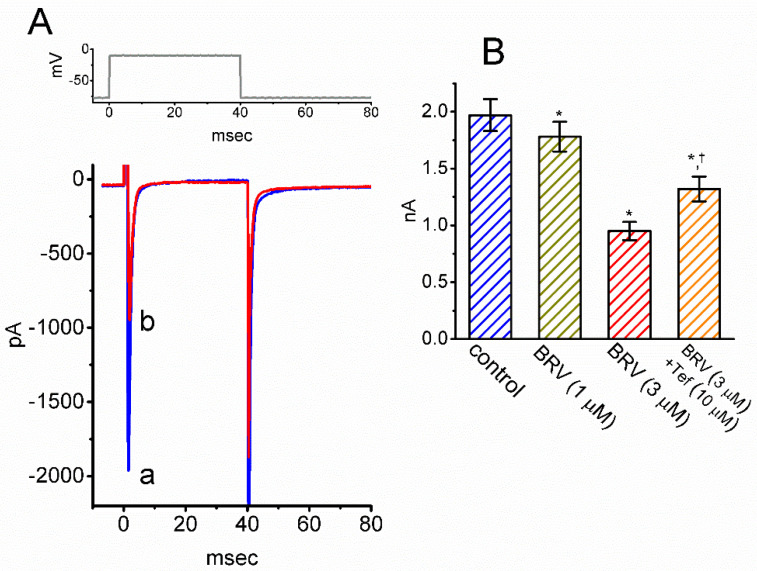
Figure 7.
Inhibitory effect of BRV on INa in mHippoE-14 hippocampal neurons. (A) Representative INa traces obtained in the absence (a, blue color) and presence (b, red color) of 3 µM BRV. The upper part is the voltage protocol delivered; (B) Summary bar graph showing the effects of BRV and BRV plus tefluthrin (10 µM) on the peak amplitude of INa in these cells (mean ± SEM; n = 8). * Significantly different from control (p < 0.05) and Ɨ significantly different from 3 µM BRV-alone group (p < 0.05).

