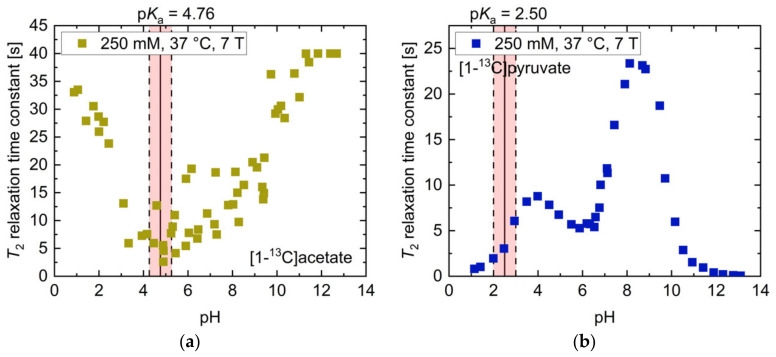
Figure 2.
pH titration curves of 250 mM thermally polarized [1-13C]acetate and 250 mM [1-13C]pyruvate at 37 °C and 7 T. (a) The pH dependence of [1-13C]acetate qualitatively resembles that observed at 14.1 T (Figure 1a), but shows higher absolute T2 relaxation times and a linear increase from pH close to its pKa to strongly basic pH values. (b) The titration curve of [1-13C]pyruvate exhibits two maxima at slightly basic and moderately acidic pH and a local minimum at pH 6, together with drastically shortened T2 values in the strongly acidic and basic regimes. The range of ±0.5 pH steps around the pKa values of the molecules is indicated in red.

