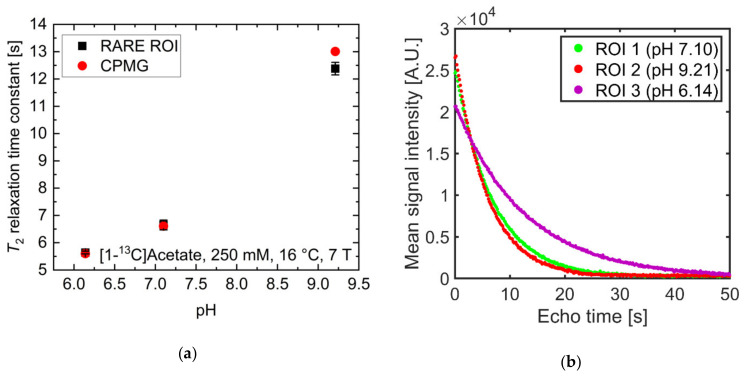
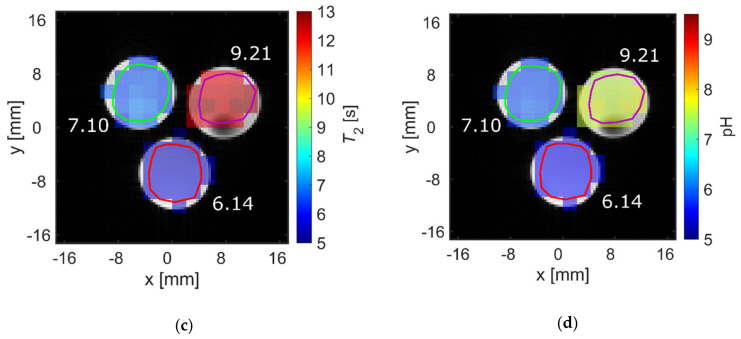
Figure 4.
(a) Comparison of T2 values of [1-13C]acetate measured with a Carr-Purcell-Meiboom-Gill (CPMG) sequence separately for each tube (red) and derived from averaging T2 values within regions of interest analysis of T2 maps generated from rapid acquisition with relaxation enhancement (RARE) imaging data (black). Mean relaxation times show good agreement between acquisition modalities, despite RARE-derived T2 values for each tube being slightly shorter than the corresponding CPMG-derived values. (b) Echo trains in tubes of different pH values. Signal curves were derived from echo images and averaged across regions of interest (green, red, or magenta). They show good preservation of transversal magnetization in later echoes. (c) T2 map generated from voxel-wise mono-exponential fitting of echo trains, showing homogeneity within and high contrast between tubes. (d) pH map generated using an estimated linear relationship between T2 and pH, derived from the titration curve in Figure 2a. In this manner, the pH of the tubes can be estimated with 0.1 pH unit intra-tube voxel-by-voxel variation and with an absolute accuracy of 1.6 pH units.


