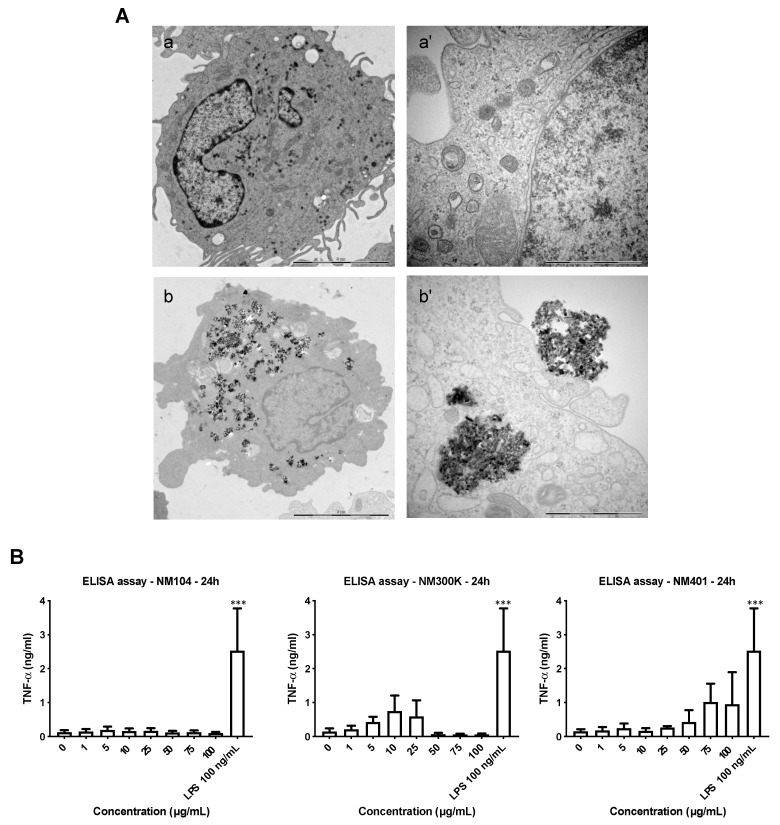
Figure 2.
Cellular impact of representative NMs. (A) TEM images of untreated THP-1 cells (a,a’) and cells exposed to TiO2 NMs for 24 h at 25 µg/mL (b,b’). Scale bars: 5 µm (a,b) and 1 µm (a’,b’). Refer to Figure S1 for additional findings derived from the TEM imaging. (B) THP-1 cells were exposed to TiO2 NMs (NM104), Ag NMs (NM300K), and MWCNTs (NM401) for 24 h and TNF-α production was measured by ELISA. The results are mean values ± S.D. of three independent experiments. *** p < 0.001.

