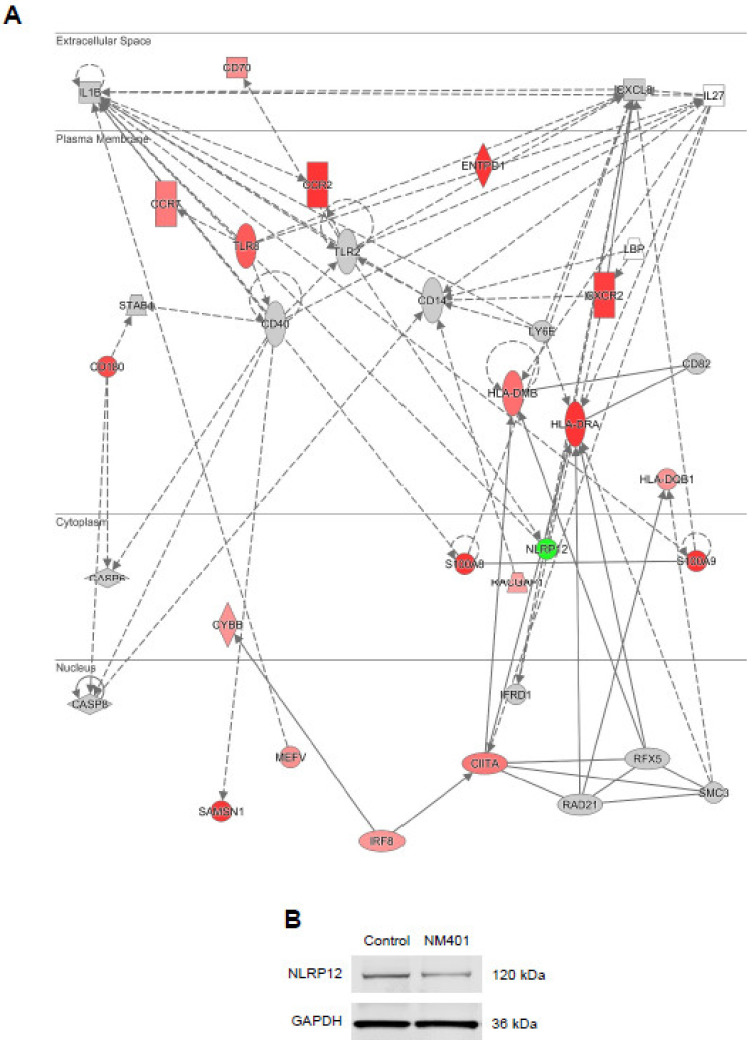
Figure 5.
Impact of MWCNTs on the chemokine signaling network in macrophage-like cells. (A) The figure depicts the transcriptomics results for MWCNT-exposed (25 µg/mL) THP-1 cells at 24 h. The color coding shows upregulated (red) and downregulated genes (green). Data were analyzed and visualized by using the IPA software tool (Qiagen, Inc., www.qiagenbioinformatics.com/products/ingenuity-pathway-analysis). (B) Western blot assay for the expression of NLRP12 in THP-1 cells exposed or not to MWCNTs (25 µg/mL) for 24 h. GAPDH was included as a loading control.

